bert hubert 🇺🇦🇪🇺 on Nostr: But here is the same data, but now with a third order fit. And suddenly the fit on ...
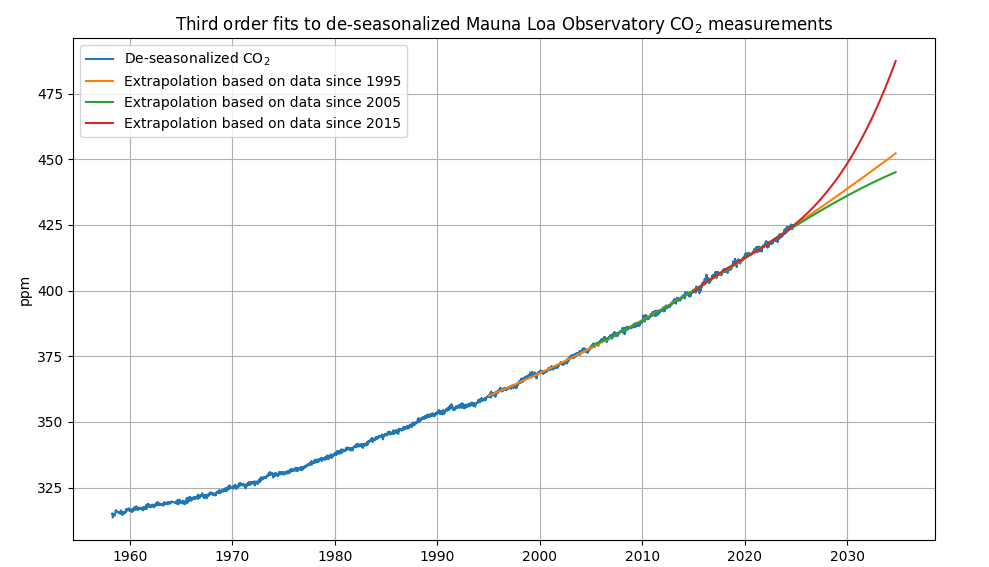
But here is the same data, but now with a third order fit. And suddenly the fit on data from 2015 and beyond looks HELLA scary. Let us hope this is only a warning of the danger of fitting data using orders that are too high. Code on
https://github.com/berthubert/co2plots data from Scripps Institution of Oceanography, San Diego

Published at
2024-10-17 20:40:46Event JSON
{
"id": "2995617d9ed8a36afa320d81cb9d009f5e67895daff22afdf1406c5fedd60c37",
"pubkey": "dc9fca0c311cbbf9886e13164c6475fa3d88b0645ad97502e7102af2dbcb0d09",
"created_at": 1729197646,
"kind": 1,
"tags": [
[
"e",
"095d0e489a9caab034f0b579c60e7076e594895e3a7518ab697d0609b595e246",
"wss://nostr.sprovoost.nl",
"reply"
],
[
"proxy",
"https://fosstodon.org/users/bert_hubert/statuses/113324696949702233",
"activitypub"
]
],
"content": "But here is the same data, but now with a third order fit. And suddenly the fit on data from 2015 and beyond looks HELLA scary. Let us hope this is only a warning of the danger of fitting data using orders that are too high. Code on https://github.com/berthubert/co2plots data from Scripps Institution of Oceanography, San Diego\n\nhttps://cdn.fosstodon.org/media_attachments/files/113/324/682/656/098/184/original/4fb27e6eb1dbd99b.png",
"sig": "decd88f59f1df3c44bd8964f76717c9dbe2a81369e9332e4718ffa22d585dd15940377425281be89b4202008e23612c5a738f5605e08a1ac94f8391fe55be580"
}


