
quoting note1tdc…0384Prolific Jointz Market Update - Bitcoin Analysis with Market Cipher (August 13, 2024)
Welcome to the latest edition of Prolific Jointz Market Update. Today, we provide an in-depth analysis of Bitcoin (BTC/USD) using Market Cipher. This update covers multiple timeframes to give you a comprehensive view of the market sentiment and potential trading opportunities.
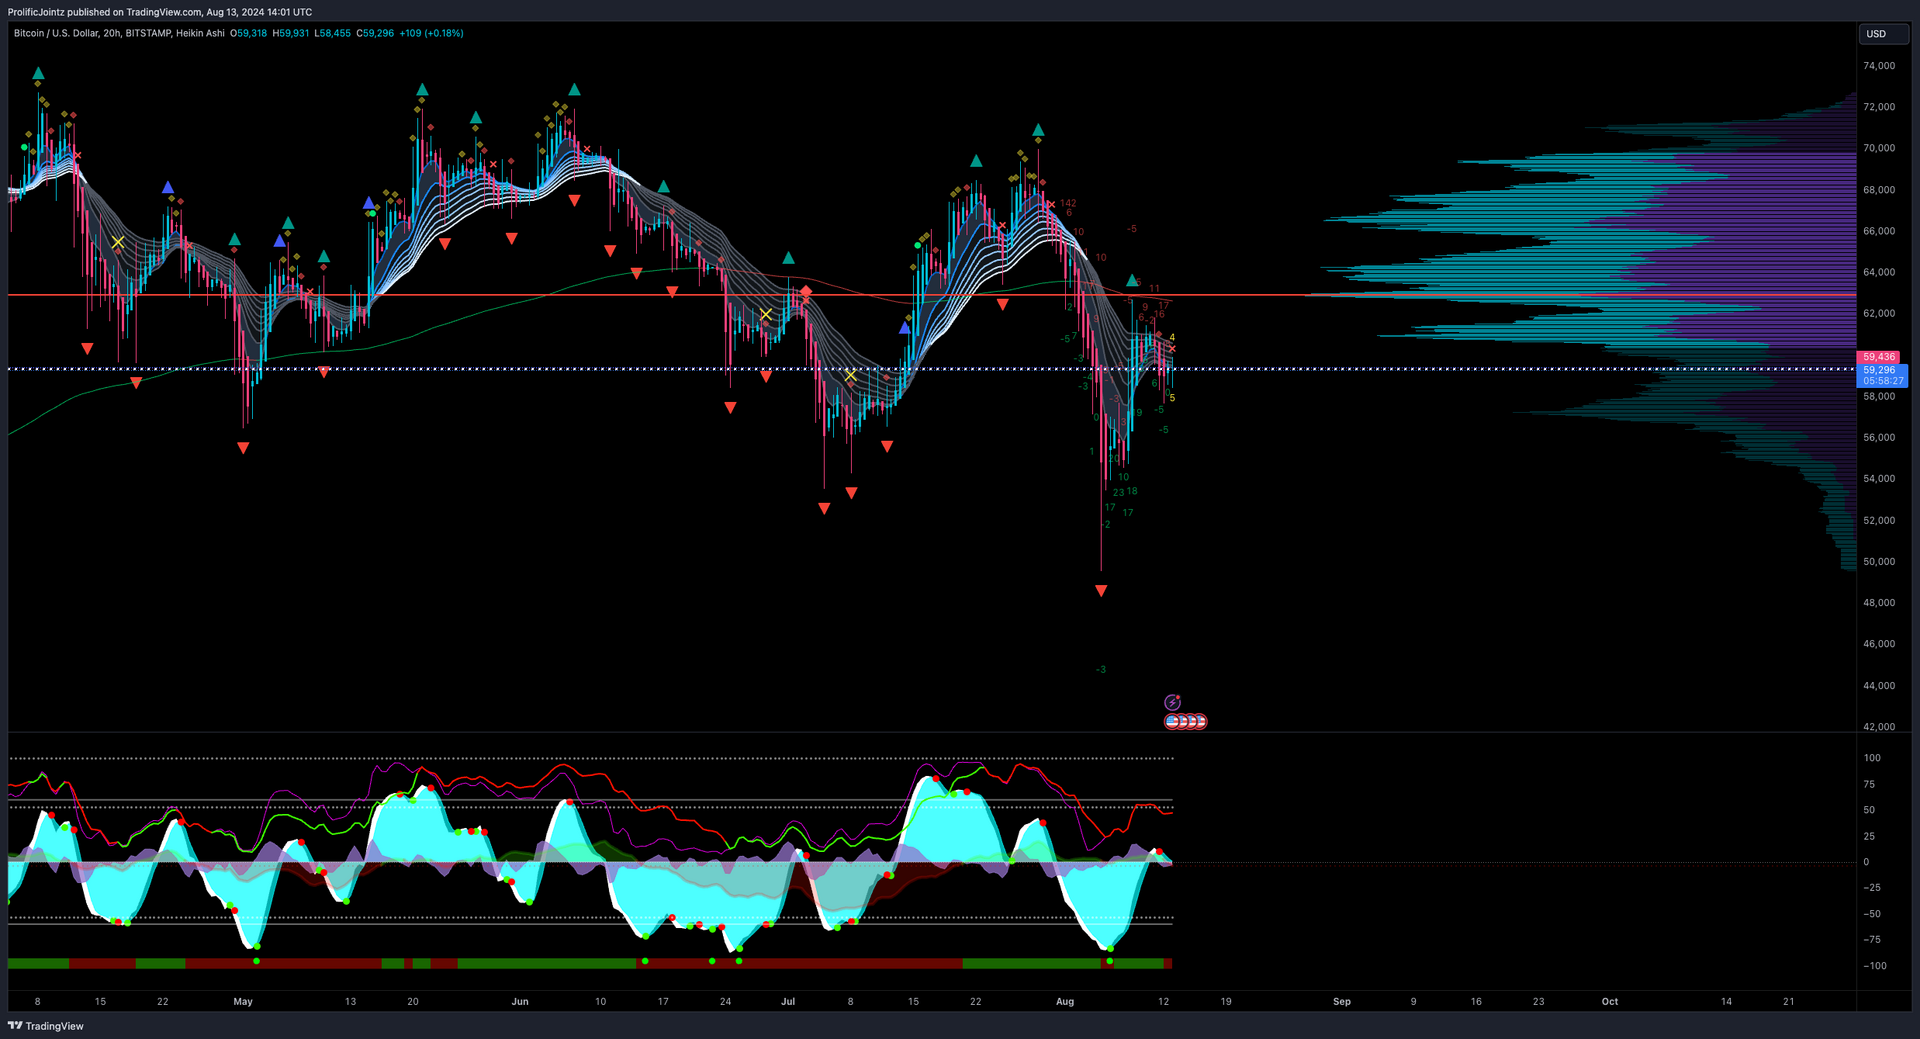
Overview of the Current Market Situation:
Bitcoin’s price action shows signs of mixed sentiment across various timeframes. There are hints of consolidation with some potential downside pressure. This analysis focuses on key levels and market sentiment to help guide your trading decisions.
Detailed Analysis by Timeframe:
1-Hour Chart
• Trend: Sideways consolidation with slight bearish bias.
• Indicators:
• Momentum waves: Decreasing strength.
• Money flow: Neutral.
• VWAP Level: $59,394.
• Support Level: $58,000.
• Resistance Level: $61,000.
• Sentiment: Neutral to Bearish.
• Probability: Long 45%, Short 55%.
• Summary: The 1-hour chart indicates a sideways movement with a slight bearish tendency. Caution is advised for long positions as the market lacks momentum.
4-Hour Chart
• Trend: Downtrend followed by consolidation.
• Indicators:
• Momentum waves: Weakening.
• Money flow: Negative.
• VWAP Level: $59,108.
• Support Level: $57,000.
• Resistance Level: $61,000.
• Sentiment: Bearish.
• Probability: Long 40%, Short 60%.
• Summary: The 4-hour chart suggests a bearish outlook with potential for further downside. Short positions may be favorable if the price fails to break resistance.
8-Hour Chart
• Trend: Downtrend with slight recovery.
• Indicators:
• Momentum waves: Showing divergence.
• Money flow: Negative.
• VWAP Level: $59,141.
• Support Level: $56,500.
• Resistance Level: $61,000.
• Sentiment: Bearish.
• Probability: Long 40%, Short 60%.
• Summary: The 8-hour chart aligns with the 4-hour, indicating potential further downside. Traders should consider short opportunities, particularly if resistance remains unbroken.
12-Hour Chart
• Trend: Downtrend with mild recovery attempts.
• Indicators:
• Momentum waves: Showing signs of weakening.
• Money flow: Neutral to Negative.
• VWAP Level: $59,117.
• Support Level: $55,500.
• Resistance Level: $61,000.
• Sentiment: Neutral to Bearish.
• Probability: Long 45%, Short 55%.
• Summary: The 12-hour chart presents mixed signals, with a potential for both directions. Traders should consider both long and short opportunities based on the next price movement.
1-Day Chart
• Trend: Continued downtrend with consolidation.
• Indicators:
• Momentum waves: Weakening.
• Money flow: Negative.
• VWAP Level: $59,300.
• Support Level: $54,000.
• Resistance Level: $62,000.
• Sentiment: Bearish.
• Probability: Long 35%, Short 65%.
• Summary: The 1-day chart suggests bearish sentiment continues to dominate, with potential for further downside. Consider short opportunities if the price remains below the resistance.
3-Day Chart
• Trend: Downtrend with weak recovery attempts.
• Indicators:
• Momentum waves: Weakening.
• Money flow: Negative.
• VWAP Level: $59,141.
• Support Level: $52,000.
• Resistance Level: $64,000.
• Sentiment: Bearish.
• Probability: Long 30%, Short 70%.
• Summary: The 3-day chart confirms a bearish trend. Short positions are favored as the market shows signs of continued weakness.
Weekly Chart
• Trend: Downtrend with consolidation.
• Indicators:
• Momentum waves: Weakening.
• Money flow: Negative.
• VWAP Level: $59,143.
• Support Level: $48,000.
• Resistance Level: $66,000.
• Sentiment: Bearish.
• Probability: Long 30%, Short 70%.
• Summary: The weekly chart reinforces the bearish outlook. Traders should focus on short positions, especially if the price fails to break above the resistance.
Overall Market Summary:
• Best Timeframes for Long Position: The 12-hour chart shows some potential for recovery, but caution is advised across other timeframes.
• Caution on Higher Timeframes: The analysis suggests bearish sentiment across the 4-hour to weekly timeframes. Traders should exercise caution and consider short positions until the market shows signs of a stronger recovery.
⚠️ Recommendation:
Short positions are recommended on higher timeframes. Exercise caution and stay updated with market changes.
#🌝 #Bitcoin #GSBAM
OwenG4now on Nostr: Ignore this post, he’s not a HODLer. Keep this on TWATTER. Get back to living. ...
Ignore this post, he’s not a HODLer. Keep this on TWATTER. Get back to living.