Henrik Ekenberg on Nostr: Let's call yesterday what it was: RDDT was a textbook institutional distribution day. ...
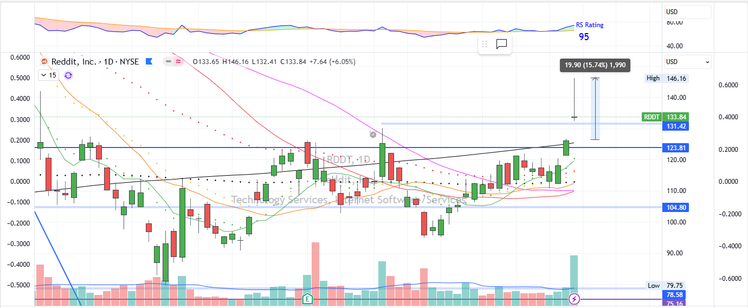
Let's call yesterday what it was: RDDT was a textbook institutional distribution day. A massive gap up on a surge of volume that gets sold into all day, closing near the low?
That's not a dip to buy. That's a giant red flag.
The professionals used the excitement and the strength of the gap to unload their shares onto amateurs who were chasing the "good move."
The stock is now guilty until proven innocent. The breakout has failed, and the chart is damaged.
Here is your new task: Go find a chart of a stock that had a similar powerful reversal day.
Analyze what it did over the next two months.
Did it collapse? Did it chop sideways for weeks before setting up again? Study the price action of failure.
You learn more from autopsies than you do from success stories.
Stop looking for your next trade and start building a model book based on what price action is actually telling you.
Want feedback on your charts?
Feel free to send me your graphs via private message — I’ll be happy to share my perspective.
Published at
2025-06-18 08:59:05Event JSON
{
"id": "07f1f60f7e10b1b109d1ef73e8a8672541b909173686dbc59855e44ea32ef500",
"pubkey": "e5de992e4d0d9d2819c14e4962a60a8f9e6f4d449e26226c194fce674a95ef85",
"created_at": 1750237145,
"kind": 1,
"tags": [
[
"client",
"noStrudel",
"31990:266815e0c9210dfa324c6cba3573b14bee49da4209a9456f9484e5106cd408a5:1686066542546"
]
],
"content": "https://nostrrelay.cloud/42a719cdda80b9277f28824f05a70d818a375507605ab998a15881a7cfd45de3.png\n\nLet's call yesterday what it was: RDDT was a textbook institutional distribution day. A massive gap up on a surge of volume that gets sold into all day, closing near the low? \n\nThat's not a dip to buy. That's a giant red flag. \nThe professionals used the excitement and the strength of the gap to unload their shares onto amateurs who were chasing the \"good move.\" \nThe stock is now guilty until proven innocent. The breakout has failed, and the chart is damaged.\n\nHere is your new task: Go find a chart of a stock that had a similar powerful reversal day. \n\nAnalyze what it did over the next two months. \nDid it collapse? Did it chop sideways for weeks before setting up again? Study the price action of failure. \nYou learn more from autopsies than you do from success stories. \nStop looking for your next trade and start building a model book based on what price action is actually telling you.\n\nWant feedback on your charts?\nFeel free to send me your graphs via private message — I’ll be happy to share my perspective.",
"sig": "d1eb087f6f3ffc5b2b729f3423f4c652d624d5d3e1cd2355ecb82cbfd82ee7905185c1b97608a174fe293850e9951a0e3f61960cc1761fa619fc2c186767d3c1"
}