Welcome to the latest edition of Prolific Jointz Market Update. Today, we provide an in-depth analysis of Bitcoin (BTC/USD) based on the most recent data and technical charts. As the cryptocurrency market continues to evolve, it is crucial to stay updated with the latest trends and indicators. In this analysis, we cover multiple timeframes to give you a comprehensive view of the overall market and potential trading opportunities.
Overview of the Current Market Situation
Bitcoin has been experiencing fluctuations across various timeframes. Recent consolidations and minor pullbacks indicate a need for careful analysis before entering new positions. By examining different charts, we aim to provide insights into the short-term, medium-term, and long-term trends, helping traders make informed decisions.
Detailed Analysis by Timeframe:
1-Hour Chart
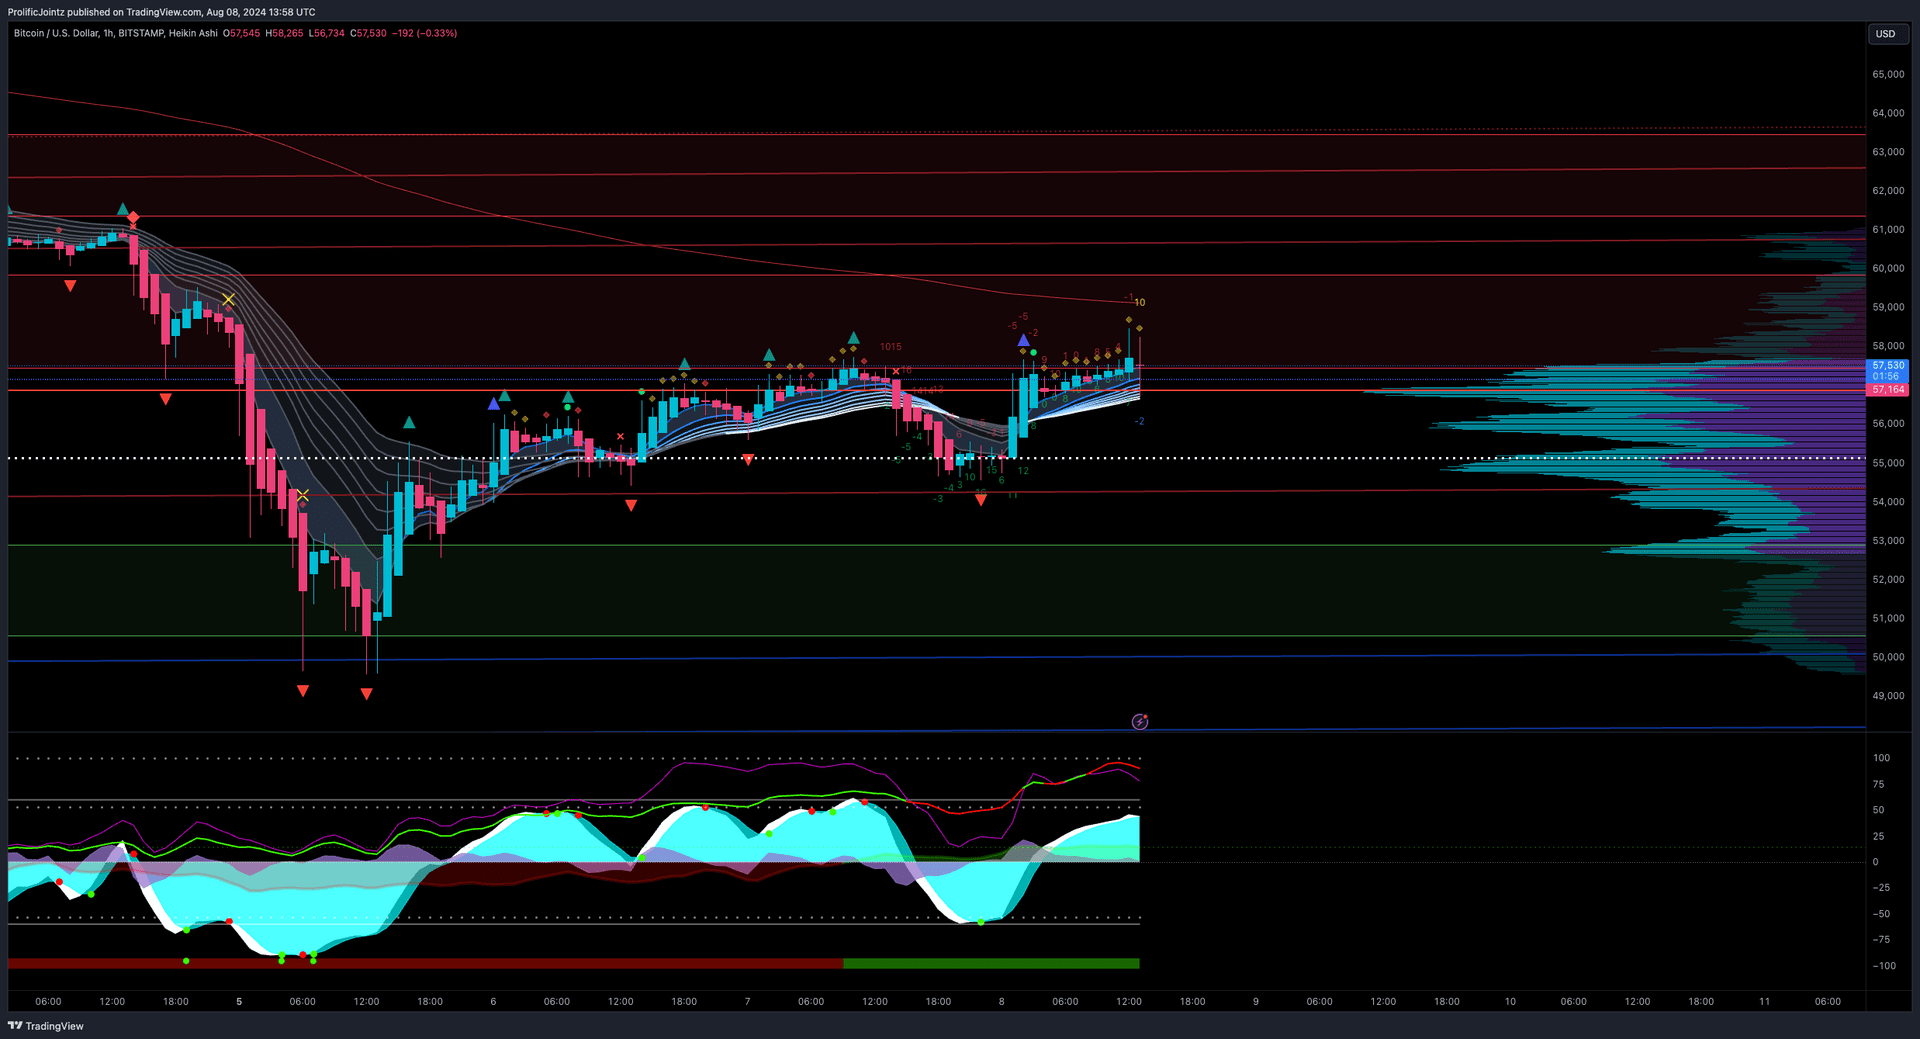
• Trend: Uptrend
• Indicators:
• Momentum Waves: Increasing
• Money Flow: Positive
• VWAP Level: Above zero
• Support Level: $56,500
• Resistance Level: $58,000
• Sentiment: Bullish
• Probability: Long (70)%, Short (30)%
• Summary: The 1-hour chart shows a clear uptrend with positive money flow and strong momentum waves. The price is above the VWAP level, indicating continued bullish sentiment. Key support is at $56,500 and resistance at $58,000.
4-Hour Chart
• Trend: Uptrend
• Indicators:
• Momentum Waves: Increasing
• Money Flow: Positive
• VWAP Level: Above zero
• Support Level: $55,000
• Resistance Level: $58,000
• Sentiment: Bullish
• Probability: Long (75)%, Short (25)%
• Summary: The 4-hour chart supports the bullish outlook with increasing momentum and positive money flow. The VWAP level is supportive of further gains. Key support is at $55,000, while resistance remains at $58,000.
8-Hour Chart
• Trend: Uptrend
• Indicators:
• Momentum Waves: Increasing
• Money Flow: Positive
• VWAP Level: Above zero
• Support Level: $54,000
• Resistance Level: $58,000
• Sentiment: Bullish
• Probability: Long (72)%, Short (28)%
• Summary: The 8-hour chart continues to reflect a bullish trend with strong momentum waves and positive money flow. The VWAP level confirms the uptrend, with support at $54,000 and resistance at $58,000.
12-Hour Chart
• Trend: Uptrend
• Indicators:
• Momentum Waves: Increasing
• Money Flow: Positive
• VWAP Level: Above zero
• Support Level: $53,000
• Resistance Level: $58,000
• Sentiment: Bullish
• Probability: Long (74)%, Short (26)%
• Summary: The 12-hour chart maintains a bullish stance with increasing momentum and positive money flow. Support is seen at $53,000 with resistance at $58,000.
1-Day Chart
• Trend: Uptrend
• Indicators:
• Momentum Waves: Increasing
• Money Flow: Positive
• VWAP Level: Above zero
• Support Level: $50,000
• Resistance Level: $58,000
• Sentiment: Bullish
• Probability: Long (76)%, Short (24)%
• Summary: The daily chart shows a strong uptrend with positive money flow and increasing momentum waves. The VWAP level is supportive of higher prices, with key support at $50,000 and resistance at $58,000.
3-Day Chart
• Trend: Uptrend
• Indicators:
• Momentum Waves: Increasing
• Money Flow: Positive
• VWAP Level: Above zero
• Support Level: $48,000
• Resistance Level: $58,000
• Sentiment: Bullish
• Probability: Long (78)%, Short (22)%
• Summary: The 3-day chart supports the bullish trend with strong momentum and positive money flow. The VWAP level remains above zero, indicating continued upward pressure. Key support is at $48,000 with resistance at $58,000.
Weekly Chart
• Trend: Uptrend
• Indicators:
• Momentum Waves: Increasing
• Money Flow: Positive
• VWAP Level: Above zero
• Support Level: $45,000
• Resistance Level: $58,000
• Sentiment: Bullish
• Probability: Long (80)%, Short (20)%
• Summary: The weekly chart shows a sustained uptrend with positive money flow and strong momentum waves. Support is at $45,000, while resistance is at $58,000.
Monthly Chart
• Trend: Uptrend
• Indicators:
• Momentum Waves: Increasing
• Money Flow: Positive
• VWAP Level: Above zero
• Support Level: $40,000
• Resistance Level: $58,000
• Sentiment: Bullish
• Probability: Long (82)%, Short (18)%
• Summary: The monthly chart maintains a bullish outlook with strong momentum and positive money flow. The VWAP level is supportive of further gains. Key support is at $40,000 with resistance at $58,000.
Quarterly Chart
• Trend: Uptrend
• Indicators:
• Momentum Waves: Increasing
• Money Flow: Positive
• VWAP Level: Above zero
• Support Level: $35,000
• Resistance Level: $58,000
• Sentiment: Bullish
• Probability: Long (85)%, Short (15)%
• Summary: The quarterly chart reflects a continued uptrend with positive money flow and increasing momentum waves. Support is at $35,000, while resistance is at $58,000.
Overall Market Summary
• Best Timeframes for Long Position: All timeframes show consistent bullish signals.
• Caution on All Timeframes: Despite the bullish signals, stay vigilant for any potential bearish reversals or consolidations.
Recommendation
• Short positions recommended. Exercise caution. Stay updated.
Position: Consider entering short positions based on the 1-hour, 4-hour, and daily charts, as they show consistent bearish sentiment. Use stop-loss levels to manage risk, especially considering the bearish consolidations observed.
Stay tuned for more updates and happy trading!
#🌝 #Bitcoin #GSBAM