Nicola Rennie on Nostr: It's Day 2 of the #30DayChartChallenge, and the prompt is "Fractions" 📊 🌎 ...
It's Day 2 of the #30DayChartChallenge, and the prompt is "Fractions" 📊
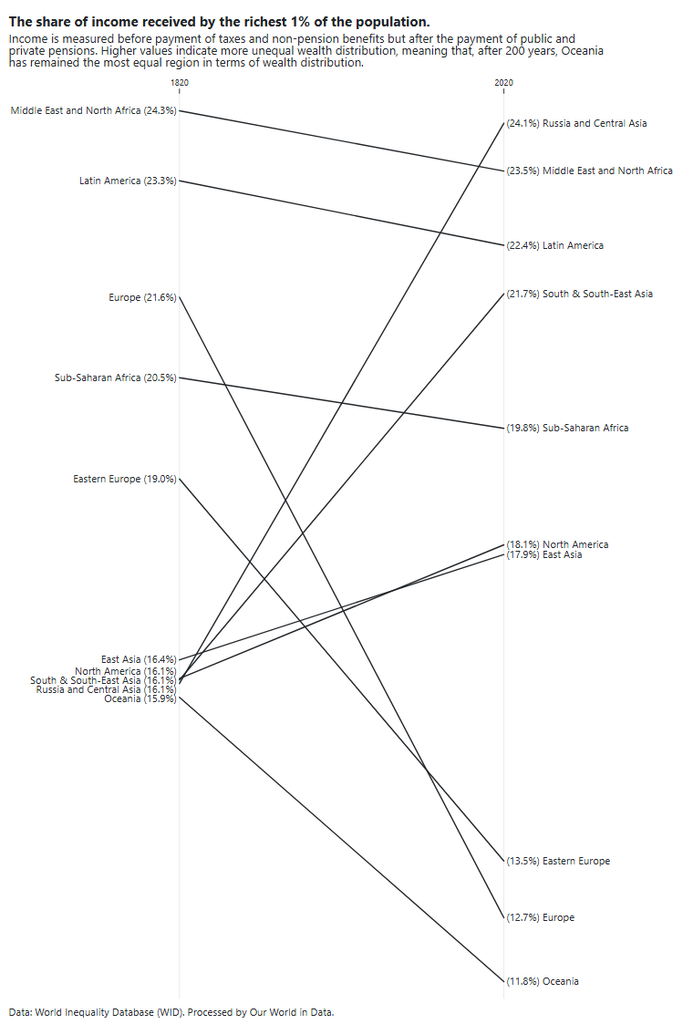
🌎 Re-using yesterday's data from Our World in Data on wealth distribution
📉 Slope chart looking at change over 200 years
👁️ Chart made with Observable
#RStats #Day2 #DataViz
Published at
2025-04-02 09:33:41Event JSON
{
"id": "6d10b15bdbc78a1c24b20cbf3f6397b8a095ee1604b12593504f3c90fff1d866",
"pubkey": "a82ca2cb099bc69209675340fa77eb6fd775a7aac964a8594a24a778d10729ac",
"created_at": 1743586421,
"kind": 1,
"tags": [
[
"t",
"30DayChartChallenge"
],
[
"t",
"rstats"
],
[
"t",
"day2"
],
[
"t",
"dataviz"
],
[
"imeta",
"url https://cdn.fosstodon.org/media_attachments/files/114/267/679/503/431/465/original/0bda7ad92167302f.png",
"m image/png",
"dim 683x1024",
"blurhash U4Ss50?b?b~qIUM{ofj[9FRjM{M{M{D%xut7"
],
[
"proxy",
"https://fosstodon.org/users/nrennie/statuses/114267679741155737",
"activitypub"
]
],
"content": "It's Day 2 of the #30DayChartChallenge, and the prompt is \"Fractions\" 📊 \n\n🌎 Re-using yesterday's data from Our World in Data on wealth distribution\n📉 Slope chart looking at change over 200 years\n👁️ Chart made with Observable\n\n#RStats #Day2 #DataViz\n\nhttps://cdn.fosstodon.org/media_attachments/files/114/267/679/503/431/465/original/0bda7ad92167302f.png",
"sig": "9b5806da80f069cbec453e836a818986bc7b18ab9f6d9d2868e74d2c0f21cfe2a983bc2b211437685ff2064aa7cda16b398d6982c9b918fb9bc4876f685d1b66"
}