Yogthos on Nostr: This chart reveals that the most disruptions of trade came after the formation of ...
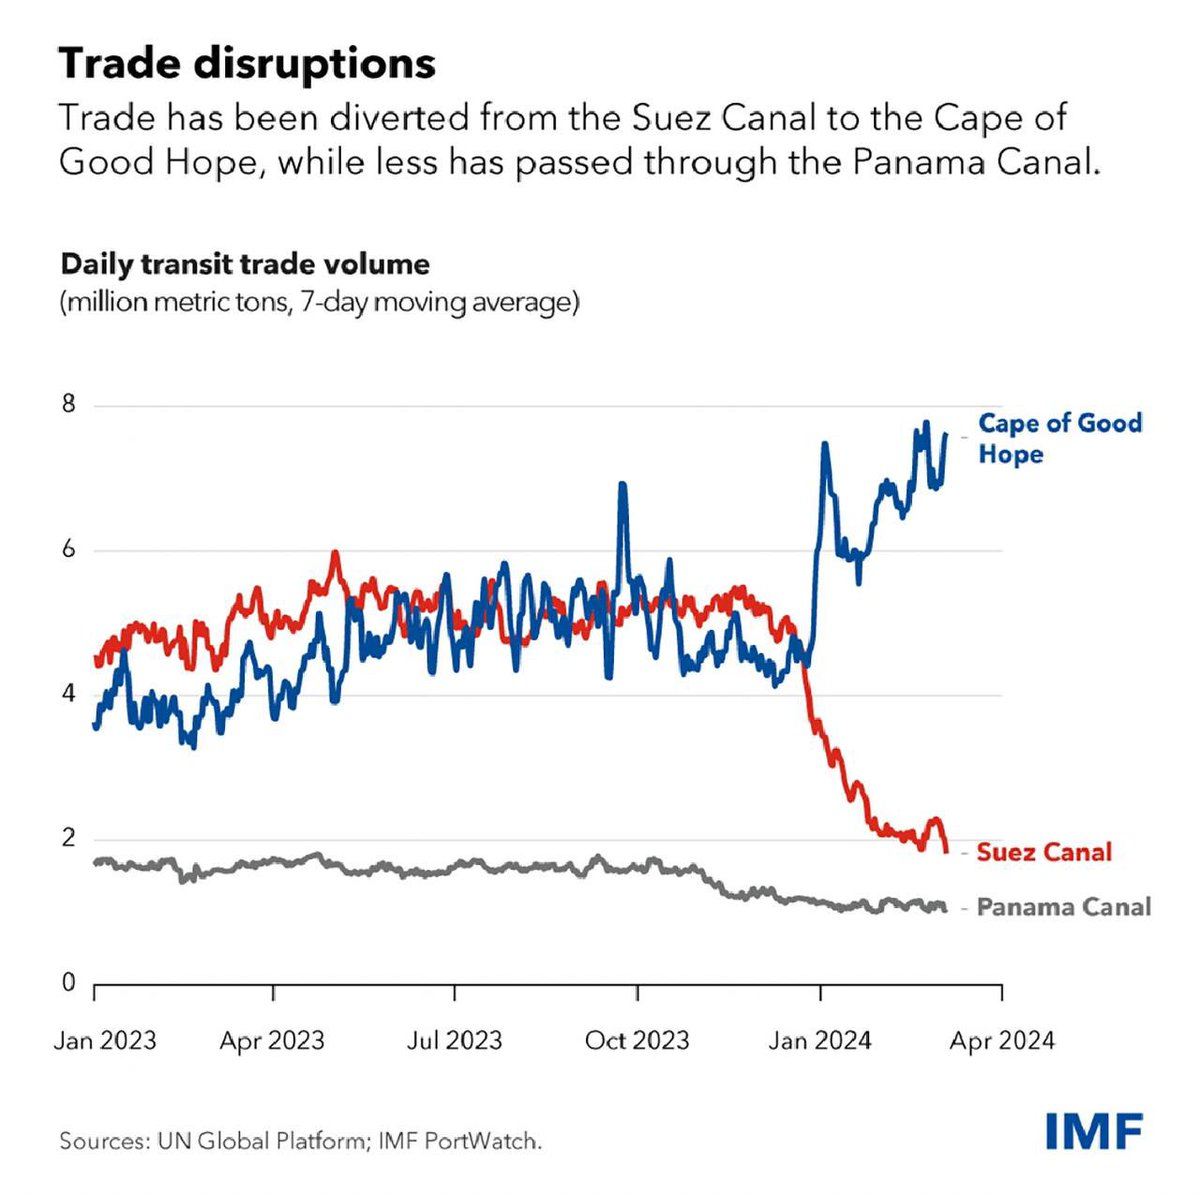
This chart reveals that the most disruptions of trade came after the formation of Operation Prosperity Guardian, and in particular right after the US started bombing Yemen on January 12th.
Disruptions were minimal between October - December.
Published at
2024-03-12 18:37:32Event JSON
{
"id": "ee4564b611b92750fb94b18e059301426fe0cf9f0a521e88d04c8ae26e666eba",
"pubkey": "71736a0449a118c82b1442b0ec6f4535bd91eeea31c85eeca684ecfb0c0d78d7",
"created_at": 1710268652,
"kind": 1,
"tags": [
[
"proxy",
"https://mas.to/users/yogthos/statuses/112084166418092043",
"activitypub"
]
],
"content": "This chart reveals that the most disruptions of trade came after the formation of Operation Prosperity Guardian, and in particular right after the US started bombing Yemen on January 12th. \n\nDisruptions were minimal between October - December.\n\nhttps://media.mas.to/media_attachments/files/112/084/163/358/936/736/original/fae8bc448b900e86.png",
"sig": "ee34145b21e3d6e88774838e05d1036f45259e29661e2b710754ad7b984e9a1000315fd3698e60cc8a75cef1e7616aaea8abe5e7333309723ffcc5630ae1d221"
}
