Event JSON
{
"id": "c7c18a271b895d71e5aecf2b68c2d6fb272f888953f26555e4db5c2e34d01af9",
"pubkey": "a82ca2cb099bc69209675340fa77eb6fd775a7aac964a8594a24a778d10729ac",
"created_at": 1741387587,
"kind": 1,
"tags": [
[
"t",
"tidytuesday"
],
[
"t",
"dataviz"
],
[
"t",
"rstats"
],
[
"t",
"dslc"
],
[
"t",
"ggplot2"
],
[
"imeta",
"url https://cdn.fosstodon.org/media_attachments/files/114/123/575/677/670/475/original/dd58689abe148ca4.png",
"m image/png",
"dim 2100x1650",
"blurhash UaIF*iVsrs%3%2WVj[ae}vX8ozR%WBayoLbH"
],
[
"proxy",
"https://fosstodon.org/users/nrennie/statuses/114123576960377535",
"activitypub"
]
],
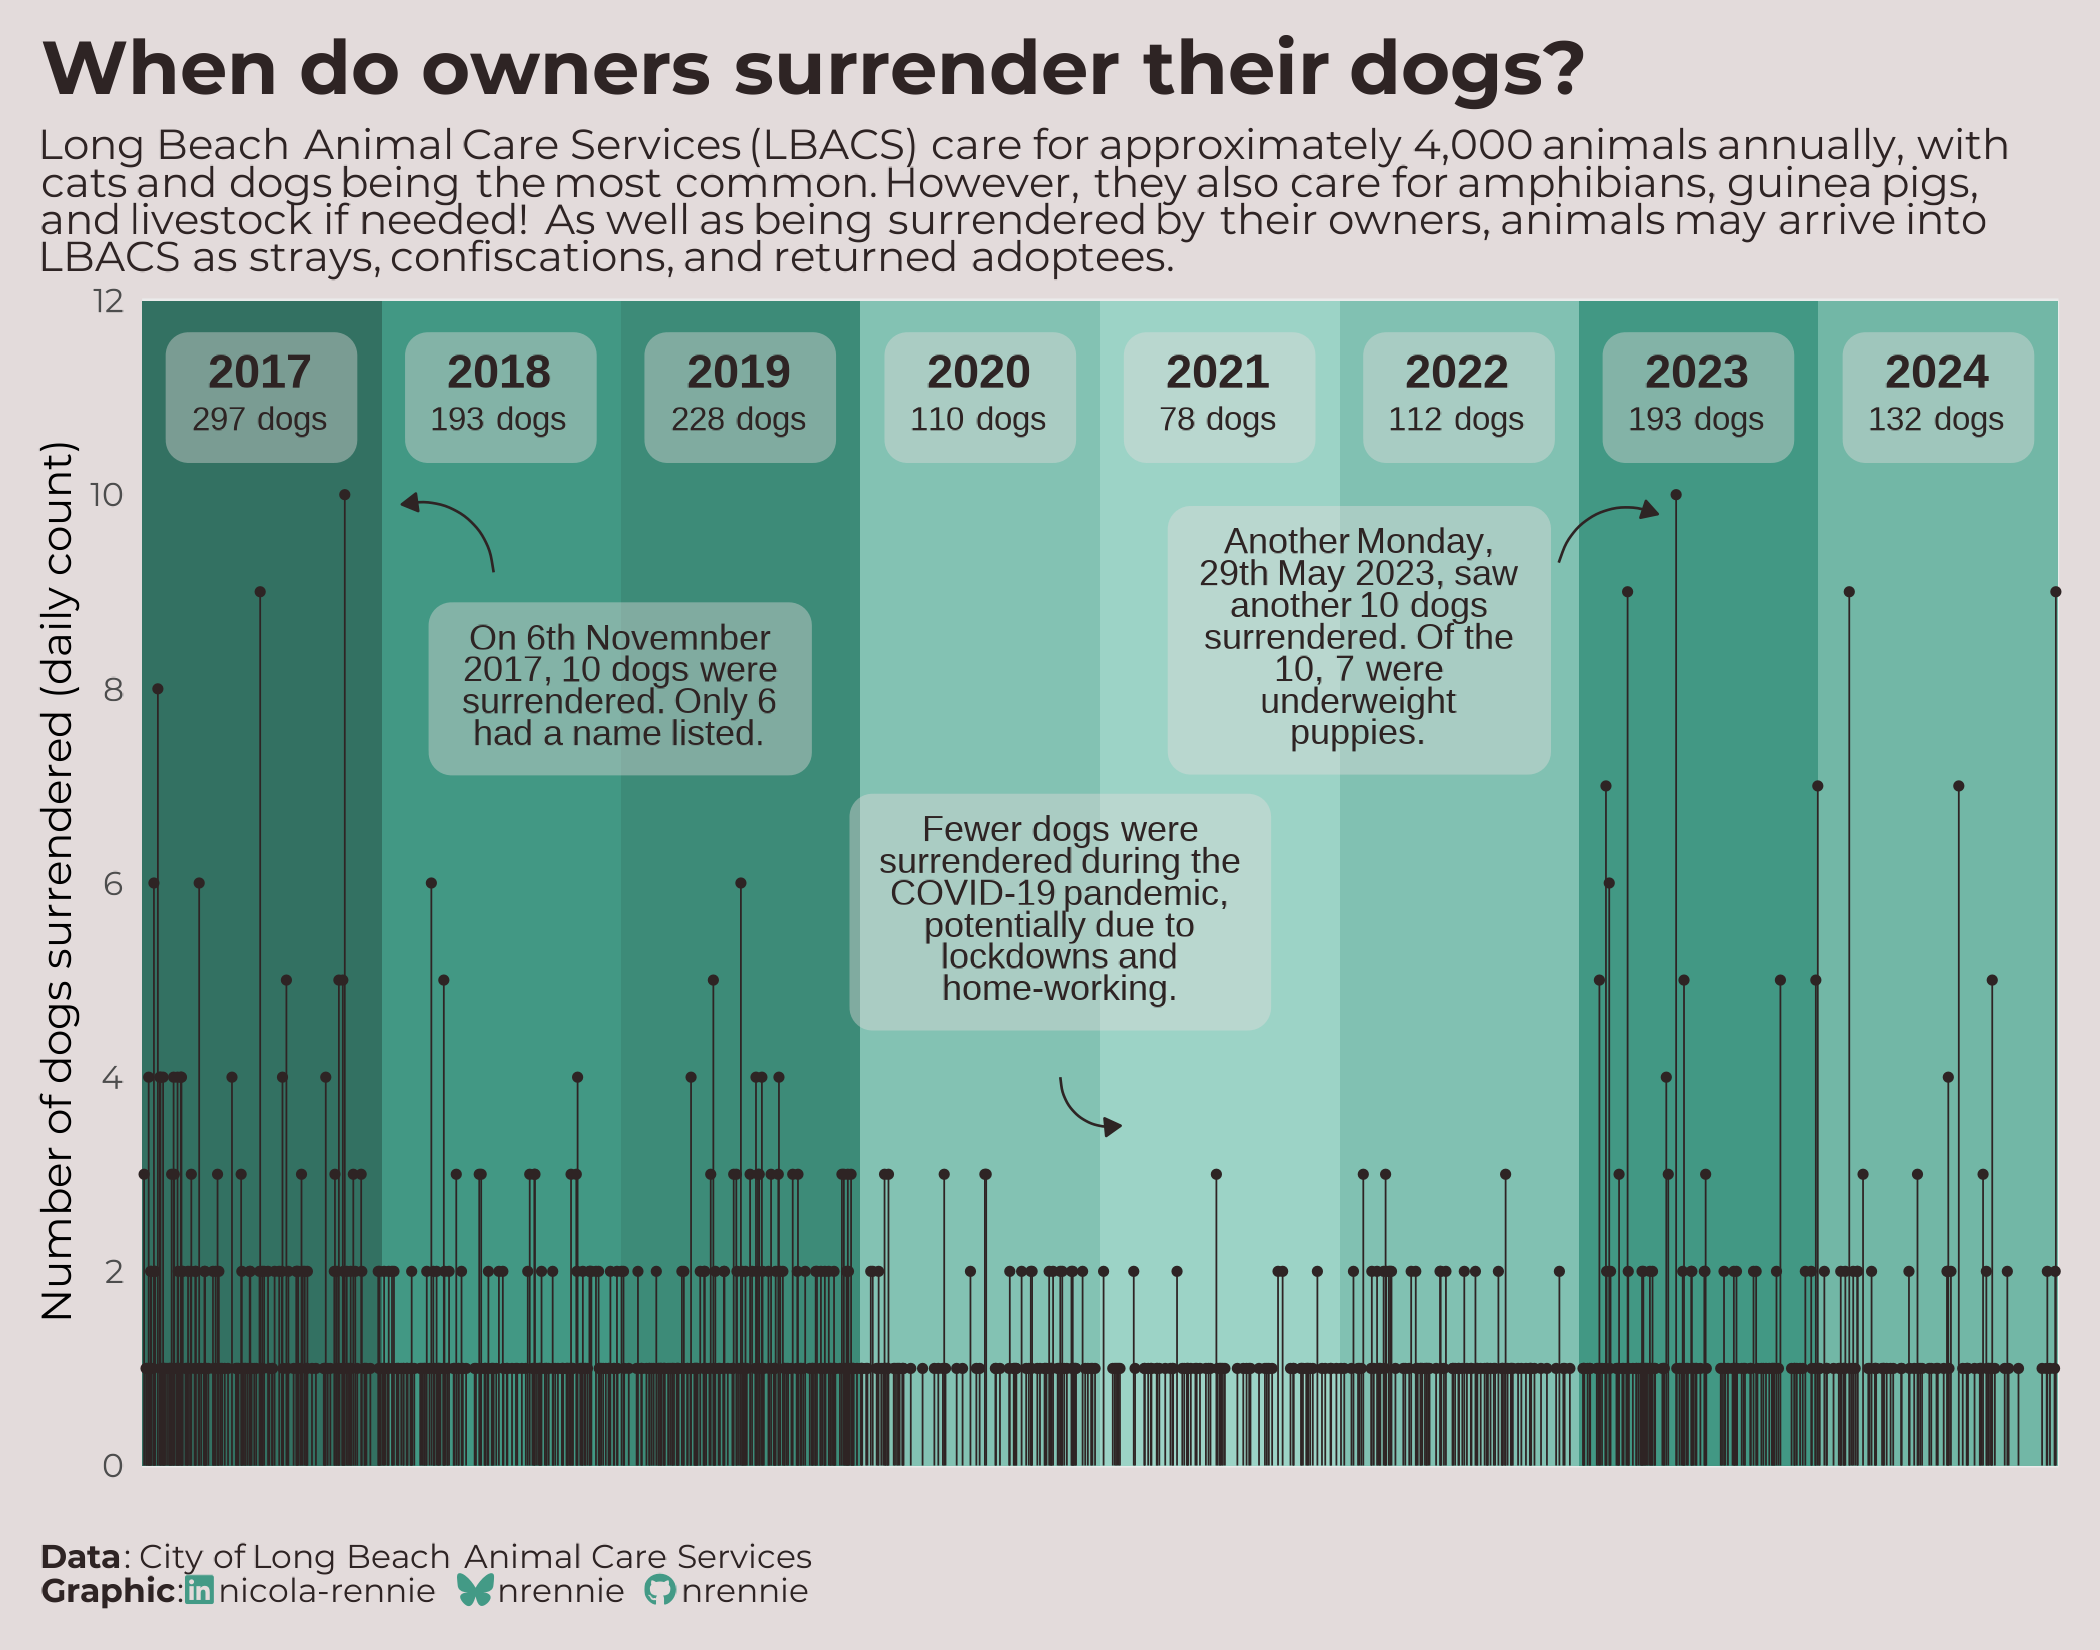
"content": "This week's #TidyTuesday data looked at animals at Long Beach animal rescue center and I focused in on the patterns when owners surrender their dogs 🐕\n\n🎯 Aim: show higher resolution (daily) data alongside aggregate counts\n❓ Why: view temporal patterns on different scales at the same time\n📊 How: lollipop chart + background heatmap\n\nCode: https://github.com/nrennie/tidytuesday/tree/main/2025/2025-03-04\n\n#DataViz #RStats #DSLC #ggplot2\n\nhttps://cdn.fosstodon.org/media_attachments/files/114/123/575/677/670/475/original/dd58689abe148ca4.png",
"sig": "a69370717d3ef292ba5449571eec5f889985b11b05daed98cc7671584e72052c37593daa3bcaa3ae70504c95608b8fda4b62a6f710d9923cbf85998c0b2c0c41"
}
