mattaroo on Nostr: This chart shows almost $150 billion in liquidity flowing into US stocks since the ...
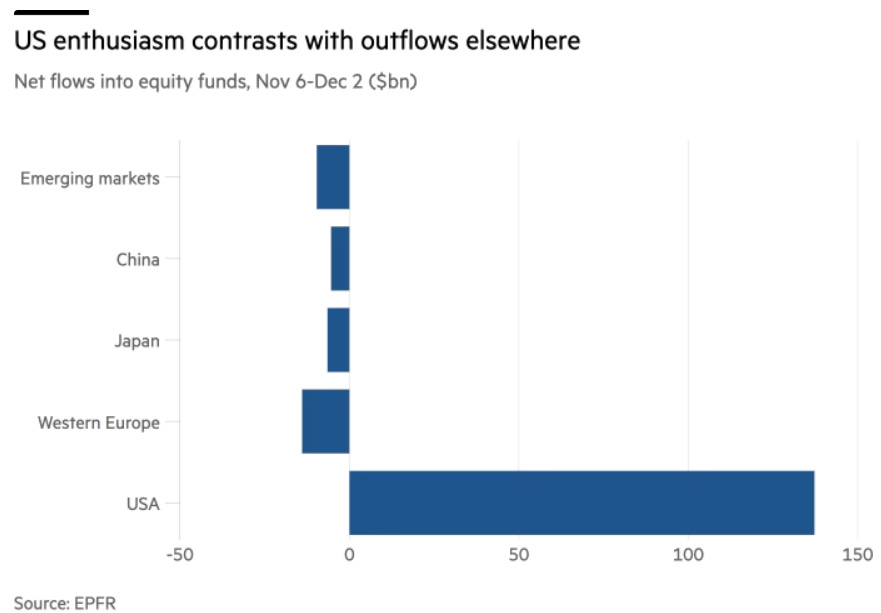
This chart shows almost $150 billion in liquidity flowing into US stocks since the election on November 5th. Money has left Europe, China, Japan, and the rest of the world.

Published at
2024-12-08 18:32:02Event JSON
{
"id": "bbac56bdf9502d4da67e1ac4dd06bd510ba6f925df4b612a1222625eef94abd0",
"pubkey": "73b90bdd05447f972ea5b7f9477c066dc7dfcacdc989212b6dbc8c79f2daee42",
"created_at": 1733682722,
"kind": 1,
"tags": [],
"content": "This chart shows almost $150 billion in liquidity flowing into US stocks since the election on November 5th. Money has left Europe, China, Japan, and the rest of the world.\n\n https://image.nostr.build/804302a0cca40fc9b7aefaa1c3434cde6a77e0064c64925ab24a00af6b6d5f4c.png",
"sig": "f47ce28faf423bccb8e55f70320a009d0077cfa8f9955216b0f4f0c6c55b1ad9fbb2e6fdd3d33c7b47a4daa70111008e6ddadbd2b0c4bb0183f1b28c904e450f"
}


