Event JSON
{
"id": "03672ab593405e741b4e37478c545cfcb01d5d8c565c80863bf79fa0024bd209",
"pubkey": "505c52e214eea5a1d344ea4cb8d2923de27bddda4de2277277914bb8a1919a5b",
"created_at": 1723743238,
"kind": 1,
"tags": [
[
"imeta",
"url https://cdn.masto.host/zirkus/media_attachments/files/112/967/220/942/677/253/original/57b345e0aad03faf.png",
"m image/png"
],
[
"t",
"schools"
],
[
"proxy",
"https://zirk.us/@ChrisMayLA6/112967236865798824",
"web"
],
[
"t",
"education"
],
[
"t",
"inequality"
],
[
"proxy",
"https://zirk.us/users/ChrisMayLA6/statuses/112967236865798824",
"activitypub"
],
[
"L",
"pink.momostr"
],
[
"l",
"pink.momostr.activitypub:https://zirk.us/users/ChrisMayLA6/statuses/112967236865798824",
"pink.momostr"
],
[
"-"
]
],
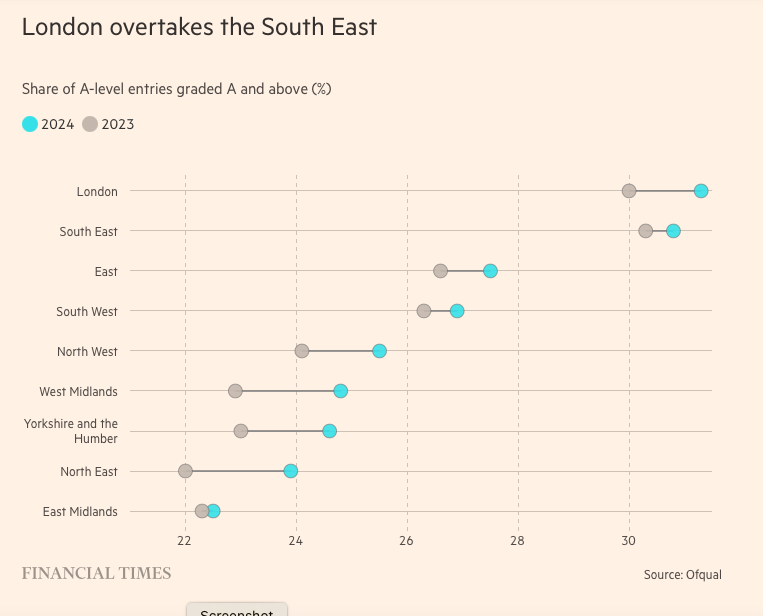
"content": "Educational inequality in one chart:\n\nWe can argue about why London get better results; wealth \u0026 tutoring? Investment? A reflection of other social issues?... and so on.\n\nHowever, what we can clearly see while all areas are seeing a rise in the share of A and above results in A-levels this year, the absolute levels reflect wide regional variations. \n\nI don't have an easy/simple explanation (other than regional economic inequality, but its more than that)....\n\n#schools #education #inequality\nhttps://cdn.masto.host/zirkus/media_attachments/files/112/967/220/942/677/253/original/57b345e0aad03faf.png\n",
"sig": "92f3394a43a104623813b69387806994c7673b4ed2eb01e158341add820e3d72cb8352101c23eca407c166d98f16ff88dd2acbaf3b44d9fffd47013c33b73c49"
}