Welcome to the latest edition of Prolific Jointz Market Update. Today, we provide an in-depth analysis of Bitcoin (BTC/USD) using Market Cipher. This update covers multiple timeframes to give you a comprehensive view of the market sentiment and potential trading opportunities.
Overview of the Current Market Situation:
Bitcoin has shown varied signals across different timeframes. Recent price action highlights areas of consolidation with potential upward movement. This analysis dives into key levels and indicators across several timeframes to inform your trading strategies.
Detailed Analysis by Timeframe:
1-Hour Chart
• Trend: Consolidation with slight upward movement
• Indicators:
• Momentum waves: Rising
• Money flow: Neutral, with slight positive bias
• VWAP Level: $61,381
• Support Level: $60,000
• Resistance Level: $62,000
• Sentiment: Neutral to Bullish
• Probability: Long 60%, Short 40%
• Summary: The 1-hour chart indicates potential short-term bullishness, but with key resistance ahead. Careful monitoring is advised around the $62,000 level.
4-Hour Chart
• Trend: Consolidation with upward pressure
• Indicators:
• Momentum waves: Stable with potential growth
• Money flow: Slightly positive
• VWAP Level: $61,382
• Support Level: $59,500
• Resistance Level: $62,000
• Sentiment: Neutral to Bullish
• Probability: Long 55%, Short 45%
• Summary: The 4-hour chart suggests some upward movement, but resistance remains strong. A break above $62,000 could validate further gains.
8-Hour Chart
• Trend: Gradual upward trend following consolidation
• Indicators:
• Momentum waves: Building
• Money flow: Positive
• VWAP Level: $61,382
• Support Level: $58,500
• Resistance Level: $62,000
• Sentiment: Neutral to Bullish
• Probability: Long 60%, Short 40%
• Summary: The 8-hour chart aligns with shorter timeframes, indicating potential for further upside if momentum holds.
12-Hour Chart
• Trend: Gradual upward trend
• Indicators:
• Momentum waves: Positive but slowing
• Money flow: Neutral to slightly positive
• VWAP Level: $61,382
• Support Level: $57,000
• Resistance Level: $62,000
• Sentiment: Neutral to Bullish
• Probability: Long 55%, Short 45%
• Summary: The 12-hour chart shows a slow but steady increase, with bullish sentiment potentially driving prices higher if resistance is broken.
1-Day Chart
• Trend: Consolidation with potential breakout
• Indicators:
• Momentum waves: Rising
• Money flow: Neutral
• VWAP Level: $61,382
• Support Level: $55,000
• Resistance Level: $62,000
• Sentiment: Neutral to Bullish
• Probability: Long 55%, Short 45%
• Summary: The daily chart suggests a consolidating market, with the potential for an upward breakout if bullish momentum continues.
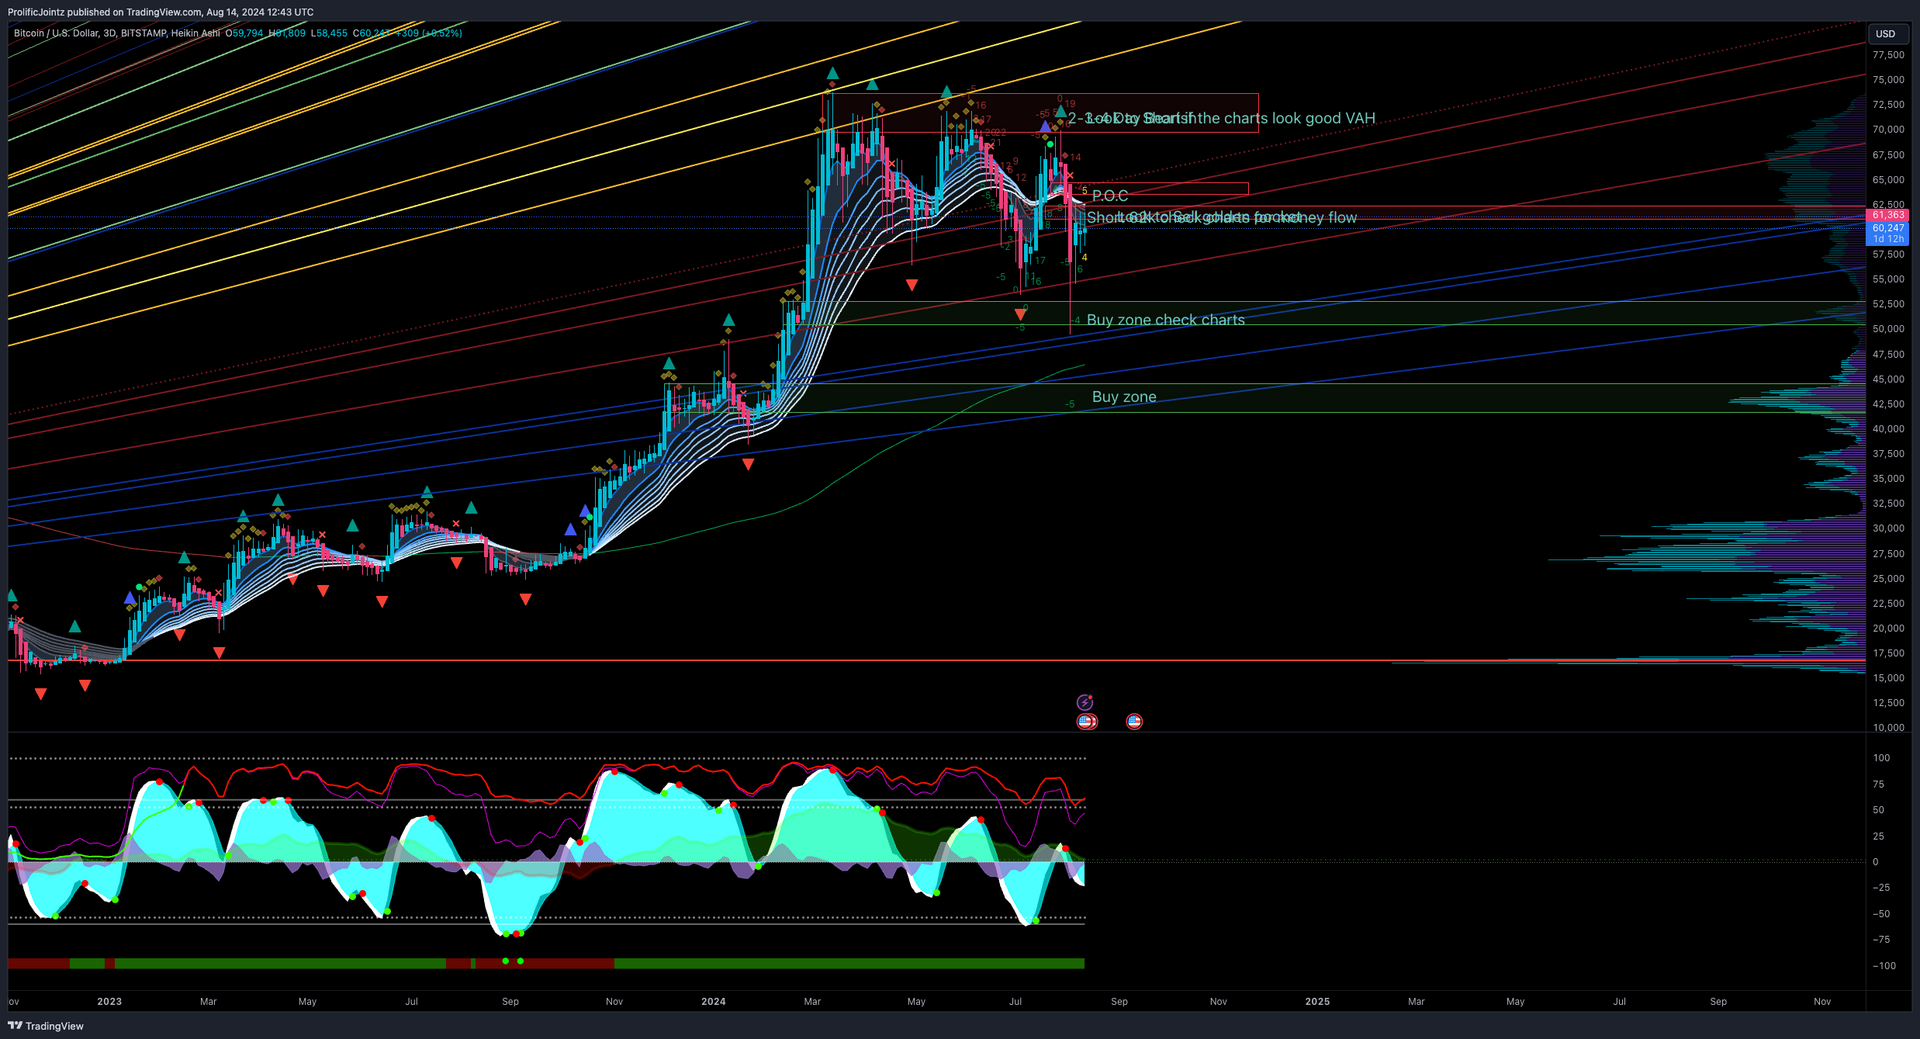
3-Day Chart
• Trend: Gradual recovery from previous lows
• Indicators:
• Momentum waves: Weak but positive
• Money flow: Slightly positive
• VWAP Level: $61,382
• Support Level: $54,000
• Resistance Level: $64,000
• Sentiment: Neutral to Bullish
• Probability: Long 60%, Short 40%
• Summary: The 3-day chart indicates a slow recovery, with resistance levels ahead that could define the next major move.
Weekly Chart
• Trend: Long-term recovery with consolidation
• Indicators:
• Momentum waves: Positive but cautious
• Money flow: Neutral
• VWAP Level: $61,382
• Support Level: $52,000
• Resistance Level: $65,000
• Sentiment: Neutral to Bullish
• Probability: Long 55%, Short 45%
• Summary: The weekly chart suggests long-term consolidation with a potential bullish breakout if key resistance is breached.
Overall Market Summary:
• Best Timeframes for Long Position: The 1-hour, 4-hour, and 8-hour charts show potential for short-term gains, particularly if resistance levels are broken.
• Caution on Higher Timeframes: The analysis suggests a cautious bullish sentiment across all timeframes, with important resistance levels to watch.
⚠️ Recommendation:
Long positions could be favorable in the short term, but monitor resistance levels closely. Stay vigilant for market changes, especially around the $62,000 and $64,000 levels.
#🌝 #Bitcoin #GSBAM