Event JSON
{
"id": "1ee40112a4a041a361f8ff0e418bba123671a46e3a2a23c090130baa0d6ae2bd",
"pubkey": "36a30783457602c172cb404d77ab5e299f0b2f486ca63ca30b3a4bf06e5c0447",
"created_at": 1723052106,
"kind": 1,
"tags": [
[
"proxy",
"https://mas.to/@assaf/112921942877647140",
"web"
],
[
"imeta",
"url https://media.mas.to/media_attachments/files/112/921/942/564/288/073/original/c178f8e7dc6c39ce.png",
"m image/png"
],
[
"proxy",
"https://mas.to/users/assaf/statuses/112921942877647140",
"activitypub"
],
[
"L",
"pink.momostr"
],
[
"l",
"pink.momostr.activitypub:https://mas.to/users/assaf/statuses/112921942877647140",
"pink.momostr"
],
[
"-"
]
],
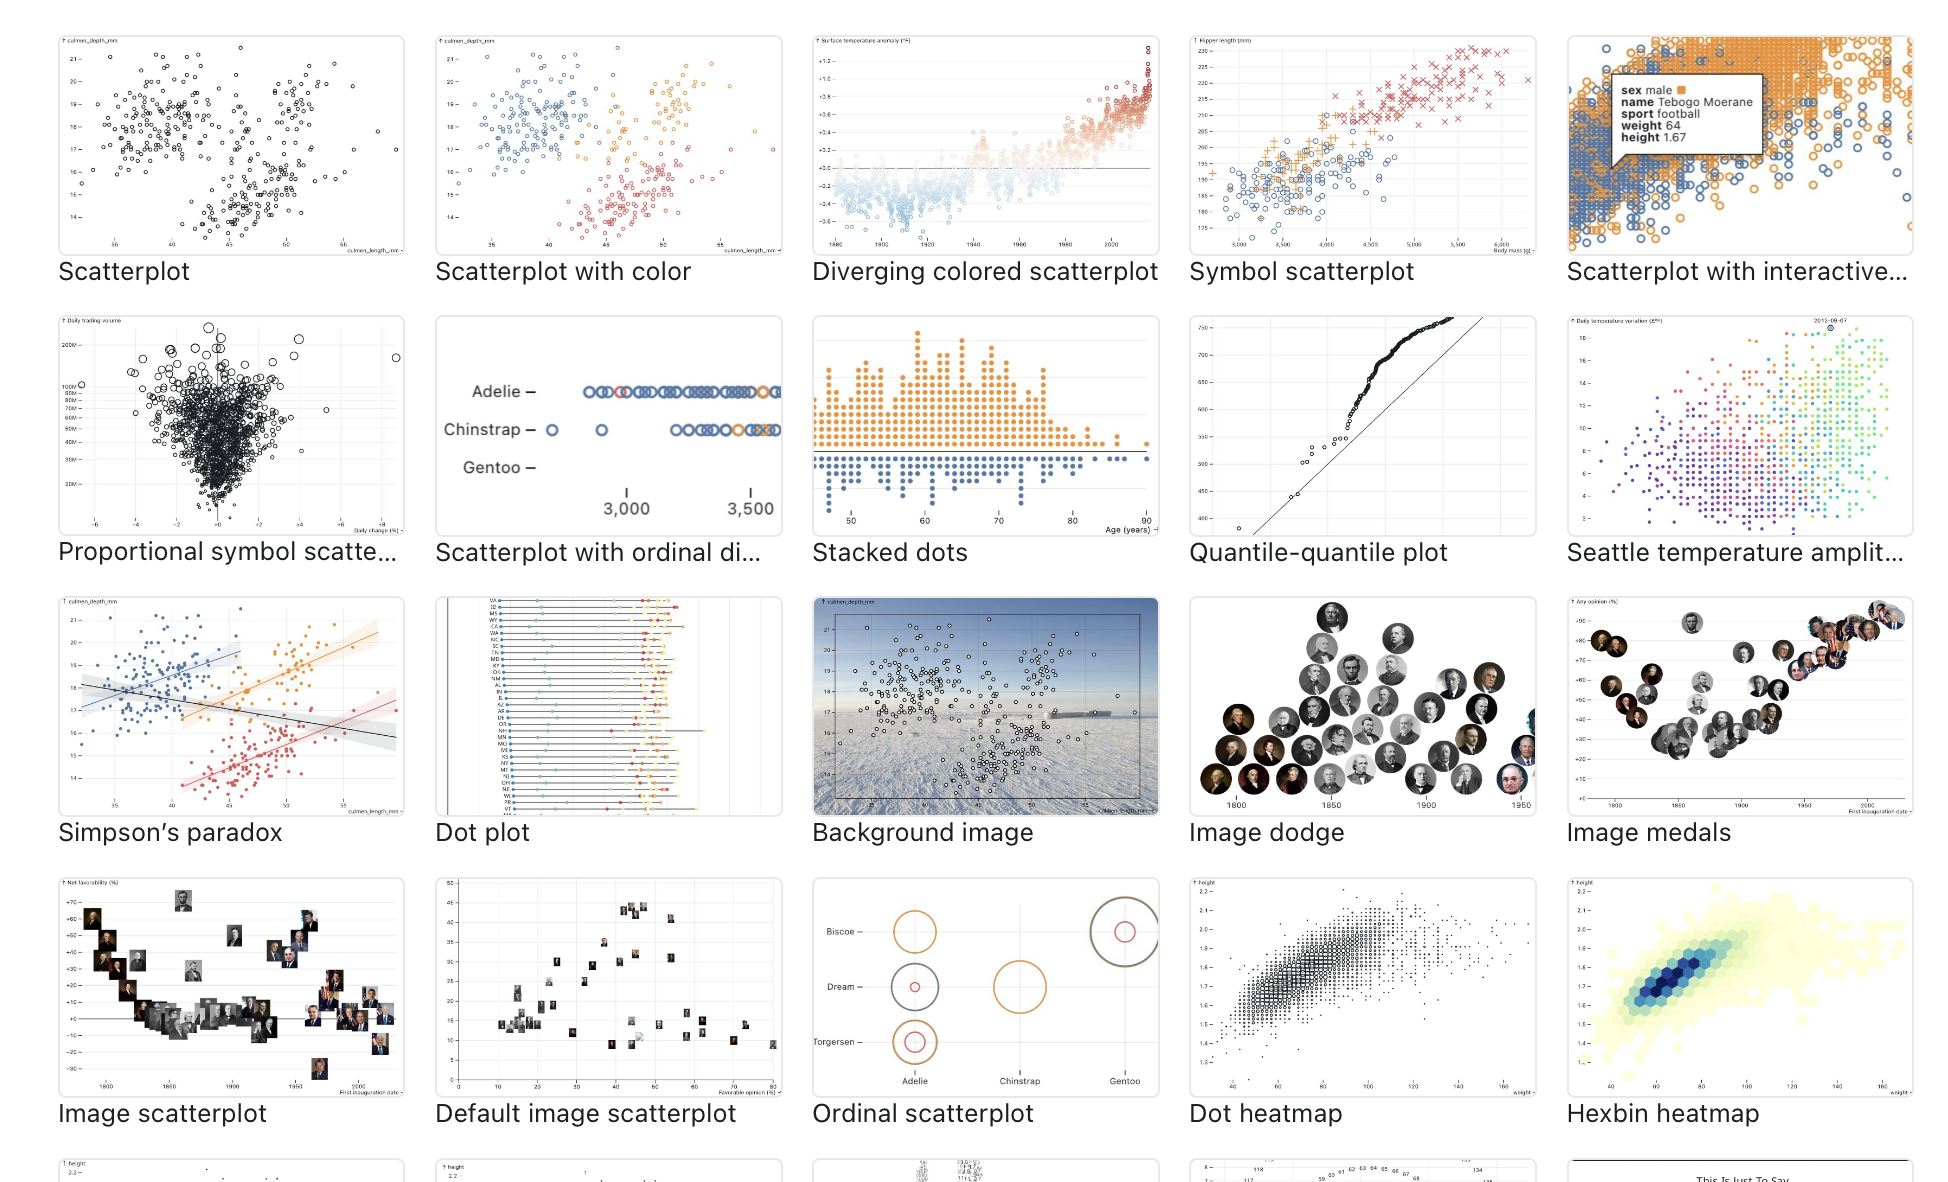
"content": "Observable Plot is a JavaScript library for data visualization from the D3 team\n\nAnd it looks pretty exhaustive\n\nhttps://observablehq.com/plot/\nhttps://media.mas.to/media_attachments/files/112/921/942/564/288/073/original/c178f8e7dc6c39ce.png\n",
"sig": "4705e1abe46a9c046c9a19a9876b57973a812d962d00aa6e73d15602082a428711aec1ecb5d1725b6e3b9222d1e05e3b749f2ed4f2f8af8f2749de2bd6ae9fc3"
}