Verna_Marino on Nostr: The 5-day SMA, 10-day SMA, 30-day SMA and 60-day SMA are all in a long alignment, and ...
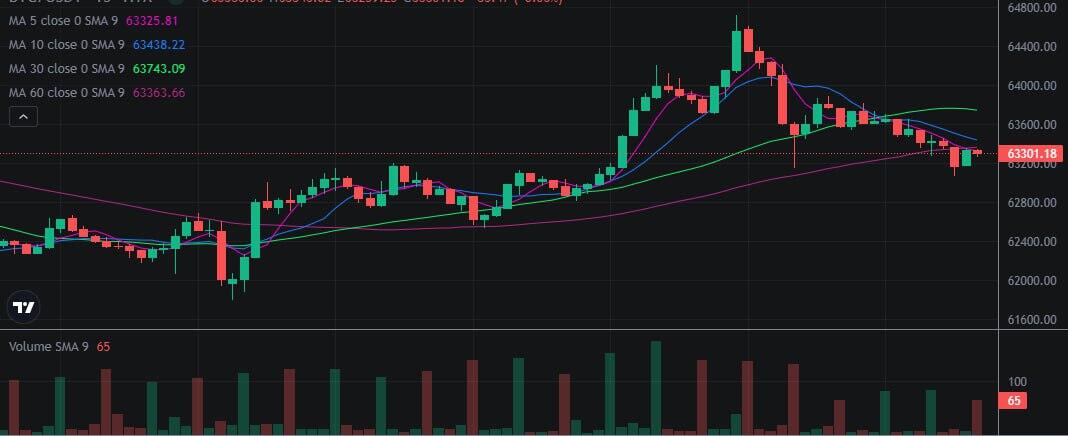
The 5-day SMA, 10-day SMA, 30-day SMA and 60-day SMA are all in a long alignment, and the 5-day SMA, 10-day SMA and 30-day SMA have all penetrated the 60-day SMA, the long trend is established
The upper Bollinger Band, middle rail and lower rail are all in a multi alignment, and the price is running near the upper Bollinger Band, the long trend is established
The MACD indicator's red kinetic column continues to shorten, the green kinetic column continues to grow, and the MACD indicator line has crossed the 0-axis, the bullish trend is established
KDJ indicator's K line, D line, J line have gone through 50, and K line, D line have gone through 80, the long trend is established
The RSI value of the RSI indicator has gone up through 70, and the RSI indicator line has gone up through 80, the long trend is established
BTC is currently in a bullish trend, investors can buy on the low side and sell on the high side #nostr #bitcoin
Published at
2024-04-30 06:08:13Event JSON
{
"id": "18e7f43660b79a89da30ebcaa81098cc0ad5829f9587932439c2adb9cb17c08e",
"pubkey": "407028214587ad0bf40b4765249fc95316d1c608ae12c0c668942fe2eb130cef",
"created_at": 1714457293,
"kind": 1,
"tags": [
[
"imeta",
"url https://image.nostr.build/005bf07a23214bd682d6408deefb992082d5507cb5d21d82299df8fc41f202c1.jpg",
"blurhash e14U$xFw,bOXs;xaIpaht7R+IoM|X8%2Na58=yO=,[NatQ-pR*M{so",
"dim 1068x436"
],
[
"t",
"nostr"
],
[
"t",
"bitcoin"
],
[
"r",
"https://image.nostr.build/005bf07a23214bd682d6408deefb992082d5507cb5d21d82299df8fc41f202c1.jpg"
]
],
"content": "The 5-day SMA, 10-day SMA, 30-day SMA and 60-day SMA are all in a long alignment, and the 5-day SMA, 10-day SMA and 30-day SMA have all penetrated the 60-day SMA, the long trend is established\n\nThe upper Bollinger Band, middle rail and lower rail are all in a multi alignment, and the price is running near the upper Bollinger Band, the long trend is established\n\nThe MACD indicator's red kinetic column continues to shorten, the green kinetic column continues to grow, and the MACD indicator line has crossed the 0-axis, the bullish trend is established\n\nKDJ indicator's K line, D line, J line have gone through 50, and K line, D line have gone through 80, the long trend is established\n\nThe RSI value of the RSI indicator has gone up through 70, and the RSI indicator line has gone up through 80, the long trend is established\n\nBTC is currently in a bullish trend, investors can buy on the low side and sell on the high side #nostr #bitcoin https://image.nostr.build/005bf07a23214bd682d6408deefb992082d5507cb5d21d82299df8fc41f202c1.jpg ",
"sig": "e9f27de7a3568eccd633d374b2d5ed533db5aaa9fde46905ca4fe4c6ca6eb7e076e1f427f0aab58c27620da4bf2cdfb3027aff94f8de9d984bb1caf5b1590255"
}