Still a bona fide noob, so take it easy.
We all understand that BTC is "going up forever" compared to fiat, but will it actually increase in purchasing power forever?
I believe so, but would like to actually track and analyze it.
Since the Consumer Price Index (CPI) is the most widely used measure of inflation, I figured it would be interesting to use this data in conjunction with Bitcoin price data to create a new metric, which I'm calling the Bitcoiner Price Index (BPI). That is, CPI is the measure of prices paid by US consumers, and BPI is the measure of relative prices paid by Bitcoiners.
I understand CPI is far from ideal or complete data, but it's what I have access to and what the mainstream economists (🤢) seem to use, so I'll use it as well, at least as a start.
I took the CPI data from the Federal Reserve Bank of St. Louis and the BTC data from CoinDesk (free API keys).
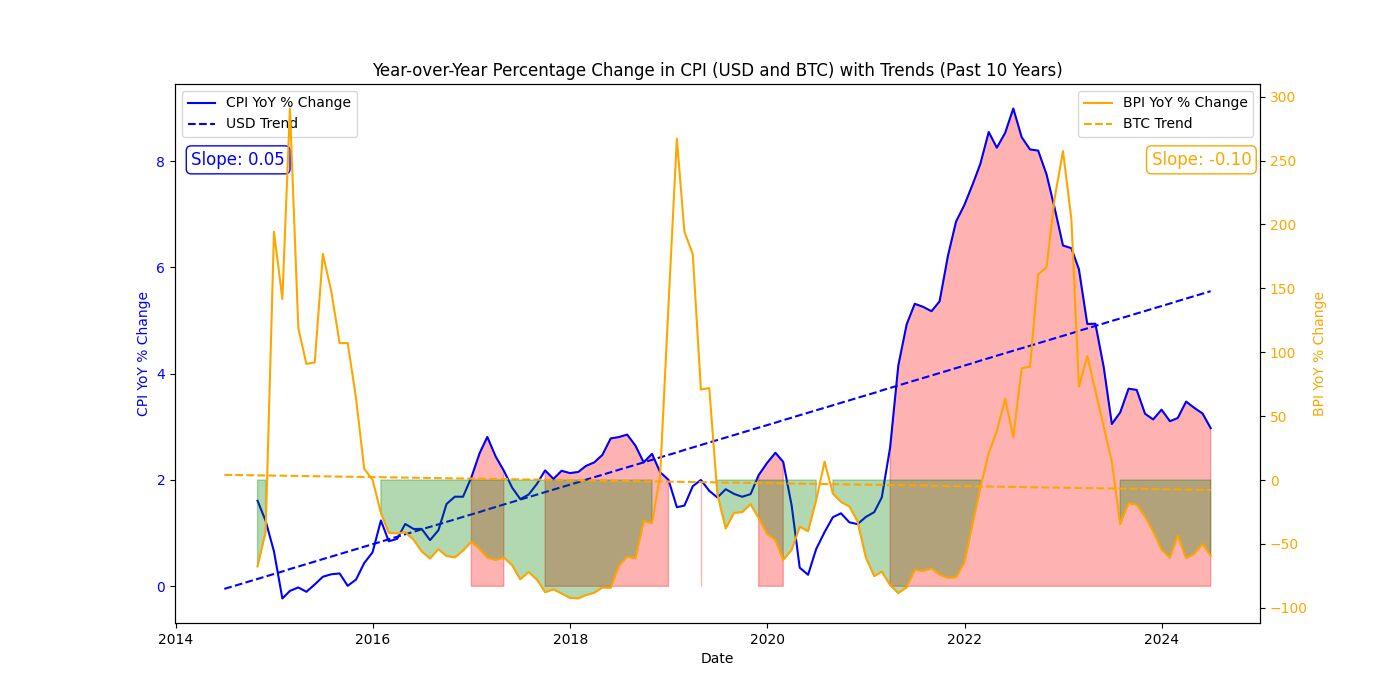
The chart below shows the past 10 years data, all that was available via API for free, in typical year-over-year fashion as well as trend lines.
Since the targeted inflation rate is 2%, I've shaded in red any time the CPI is over 2%. And since my base case is that BTC will gain purchasing power, I've shaded in green any time BPI is negative.
I'm still playing around with this, but I find it pretty interesting and different than most BTC charts I see floating around.
I figured I'd #AskNostr to get some feedback and hopefully some opinions on improved methods and/or data sources.
Based on the data thus far, the CPI trend is 0.05 and the BPI trend is -0.10, suggesting that prices are falling for bitcoiners twice as fast as they are rising in USD despite the large spikes during the bears.
I plan on following this each month when the CPI comes out, and modifying it to make improvements along the way. Should be neat to see how things go over the coming years.
#Bitcoin #Coding

