Cian O’Donnell on Nostr: Big fan of this plot showing ASD gene 'risk' on y-axis (i.e. the relative increase in ...
Big fan of this plot showing ASD gene 'risk' on y-axis (i.e. the relative increase in diagnosis likelihood if you have a genetic variant) vs variant prevalence on x-axis (fraction of general population with that genetic variant).
Some high-risk genes that are rare (top left) and other low-risk genes that are common in population.
Common phenomenon seen in many disorders: high impact mutations don't often get propagated to the next generation.
From Willsey et al 2022:
https://www.nature.com/articles/s41583-022-00576-7 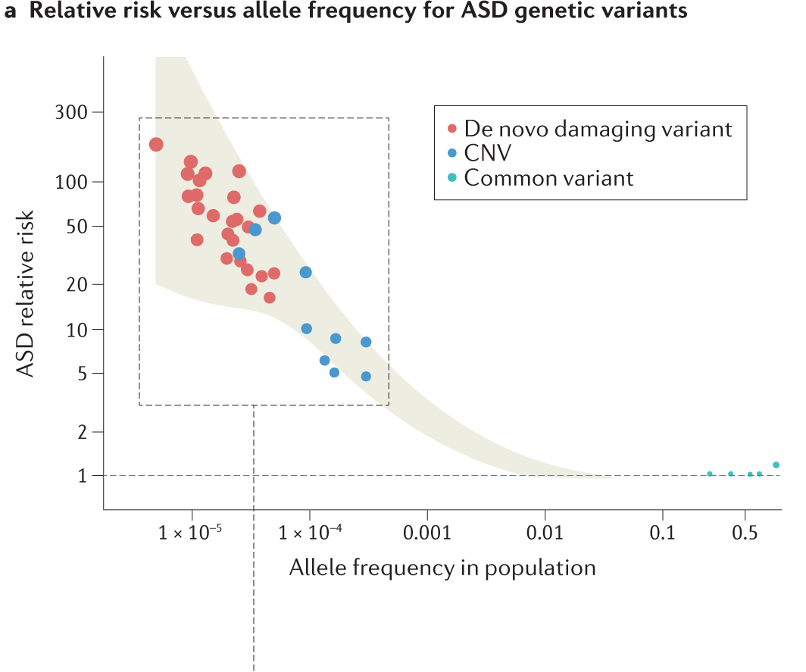
Published at
2024-09-23 15:01:22Event JSON
{
"id": "8f6d95f68a4e0b494cc8c08b51222b50bf1259f2d46d101104651e5066e31bc3",
"pubkey": "71d38b07e4b336654573c9d1543ef2fe067ef2e2ca348e6db0effd140e3f2a64",
"created_at": 1727103682,
"kind": 1,
"tags": [
[
"proxy",
"https://mstdn.science/users/cian/statuses/113187466919058921",
"activitypub"
]
],
"content": "Big fan of this plot showing ASD gene 'risk' on y-axis (i.e. the relative increase in diagnosis likelihood if you have a genetic variant) vs variant prevalence on x-axis (fraction of general population with that genetic variant).\n\nSome high-risk genes that are rare (top left) and other low-risk genes that are common in population.\n\nCommon phenomenon seen in many disorders: high impact mutations don't often get propagated to the next generation.\n\nFrom Willsey et al 2022: https://www.nature.com/articles/s41583-022-00576-7\n\nhttps://static.mstdn.science/media_attachments/files/113/187/447/393/338/023/original/e5416291b13aa386.png",
"sig": "6176c1ea4d368868097f46828f0d224c4dcf8bda3c591c6aa6d0a1e052ad506e58b6f127eef2162432544d2a8a989814f28083baa08f1a29e31b9e13a4a83e2e"
}