Jack of all trades on Nostr: Another sobering graph. X axis is Human Development Index, Y axis is Material ...
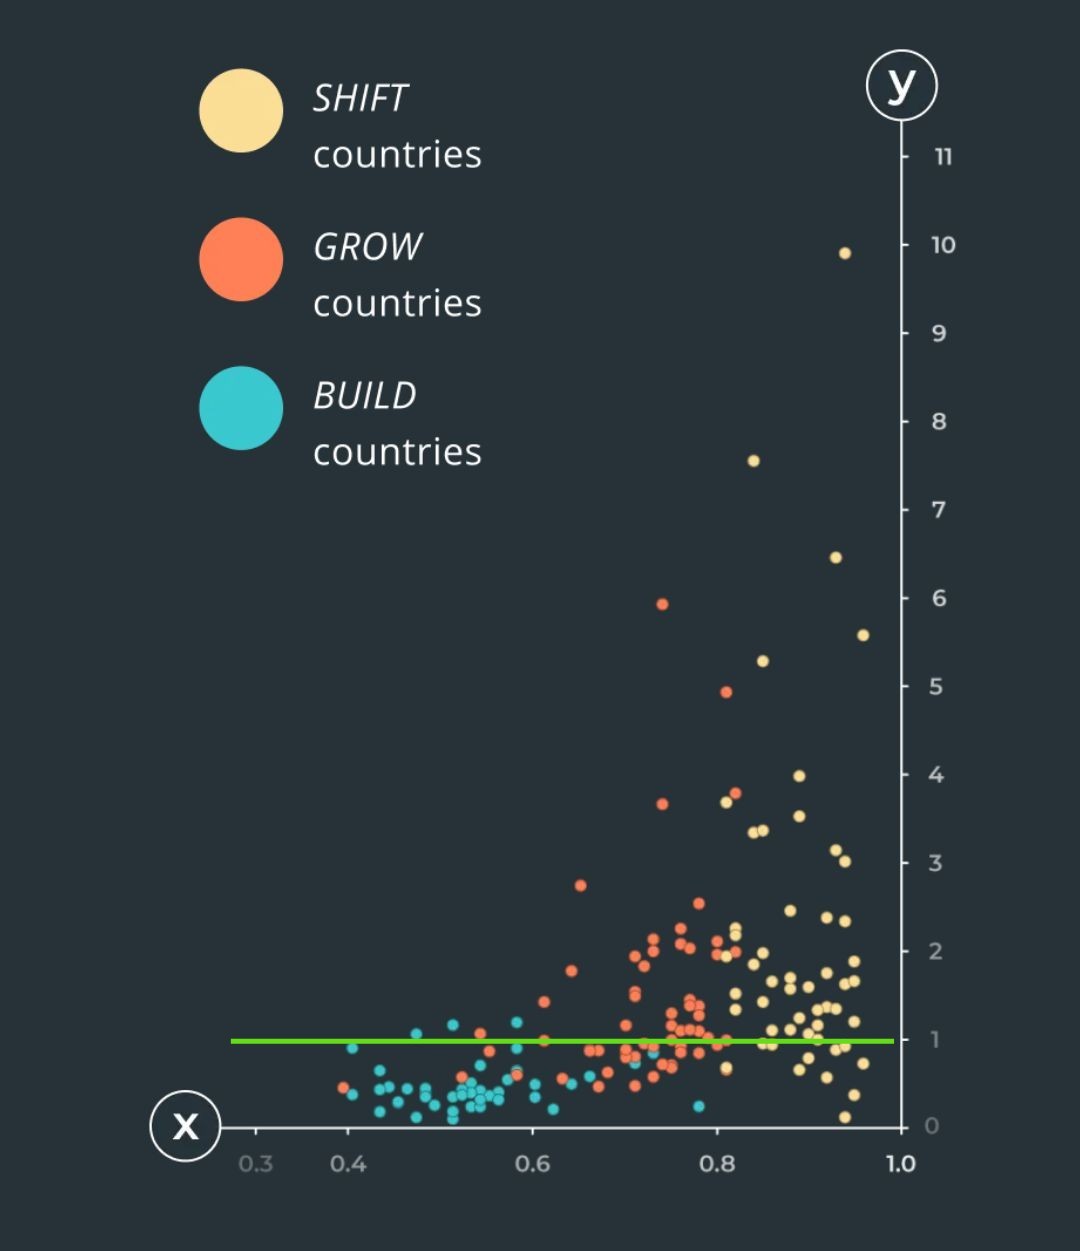
Another sobering graph. X axis is Human Development Index, Y axis is Material Footprint per capita displayed as the number of planets needed to sustain the lifestyle of each country’s average citizen.
I drew a line at 1 Earth since that's how many we have. To be sustainable everyone would need to be below the line.
I'm pretty sure the graph doesn't account for trade as it has a number of developed countries below the line.
Source of the graph:
https://www.circularity-gap.world/2024#sustainability
Published at
2024-02-07 17:16:06Event JSON
{
"id": "90bff171b1f428d65b5075b14c72fb8cb746c01b61e62c6f8c7215078c2cb942",
"pubkey": "7661cdf9eb02a684c4920d016c5973fac4fdfcf600ffe0a9018786e2b70ccb1b",
"created_at": 1707326166,
"kind": 1,
"tags": [
[
"t",
"sustainability"
],
[
"proxy",
"https://mas.to/users/jackofalltrades/statuses/111891327646820718",
"activitypub"
]
],
"content": "Another sobering graph. X axis is Human Development Index, Y axis is Material Footprint per capita displayed as the number of planets needed to sustain the lifestyle of each country’s average citizen.\n\nI drew a line at 1 Earth since that's how many we have. To be sustainable everyone would need to be below the line.\n\nI'm pretty sure the graph doesn't account for trade as it has a number of developed countries below the line.\n\nSource of the graph: https://www.circularity-gap.world/2024\n\n#sustainability\n\nhttps://media.mas.to/masto-public/media_attachments/files/111/891/312/322/513/234/original/93d4a189ca50521b.jpg",
"sig": "4f84b53a18357c3d890eedea454f879300f2b2731d6472063d344db9211bb818d22e2609a5a71ae2e813aad33250c349458043c2c4f2ec6a58e86b7eee385064"
}
