Event JSON
{
"id": "9cbe844a36dd7572d56ffe3ae08adf6743fd06cdca88024d60d2ba247d871a20",
"pubkey": "dd3b9f842cb8685cb3d702d921014f8293726b1a4553756ed528ad6c21cf876b",
"created_at": 1691544524,
"kind": 1,
"tags": [
[
"p",
"1d548759f459dc541a57e54232a644a6557a056f07dcaea1e388a55df0705516",
"wss://relay.mostr.pub"
],
[
"p",
"ce698f07514aa252ead5d22b4953dc56ac452e7438eef85e13637c1aec707a22",
"wss://relay.mostr.pub"
],
[
"e",
"2ccf61441f9b05c9f121175b44115e6744692feac3653cf7755ac0db648f4122",
"wss://relay.mostr.pub",
"reply"
],
[
"proxy",
"https://mastodon.nz/users/joncounts/statuses/110857061959964732",
"activitypub"
]
],
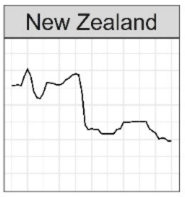
"content": "nostr:npub1r42gwk05t8w9gxjhu4pr9fjy5e2h5pt0qlw2ag0r3zj4murs25tq7msmfm Here's the trend for New Zealand in estimated effective tax rate for high income earners, between 1965 and 2015. This is from the Supplementary Material in that 2021 science paper.\n\nThe y-axis is their index of tax rate for high income earners, which includes taxes on incomes, capital, and assets. The x-axis is year, between 1965 and 2015. I clipped this out of a figure which graphs each analysed OECD country separately.\n\nhttps://doi.org/10.1093/ser/mwab061\n\nhttps://mastodon.nz/system/media_attachments/files/110/857/050/426/535/244/original/a4a7c294ef2b8eee.png",
"sig": "84b9edcd23cf8140321c958b4b03ffef8af73cc0656f88934771f09e410bcd878cf30e7e690ff9cf12024890d76f90921d531c3217e9608e1e9594788f429152"
}
