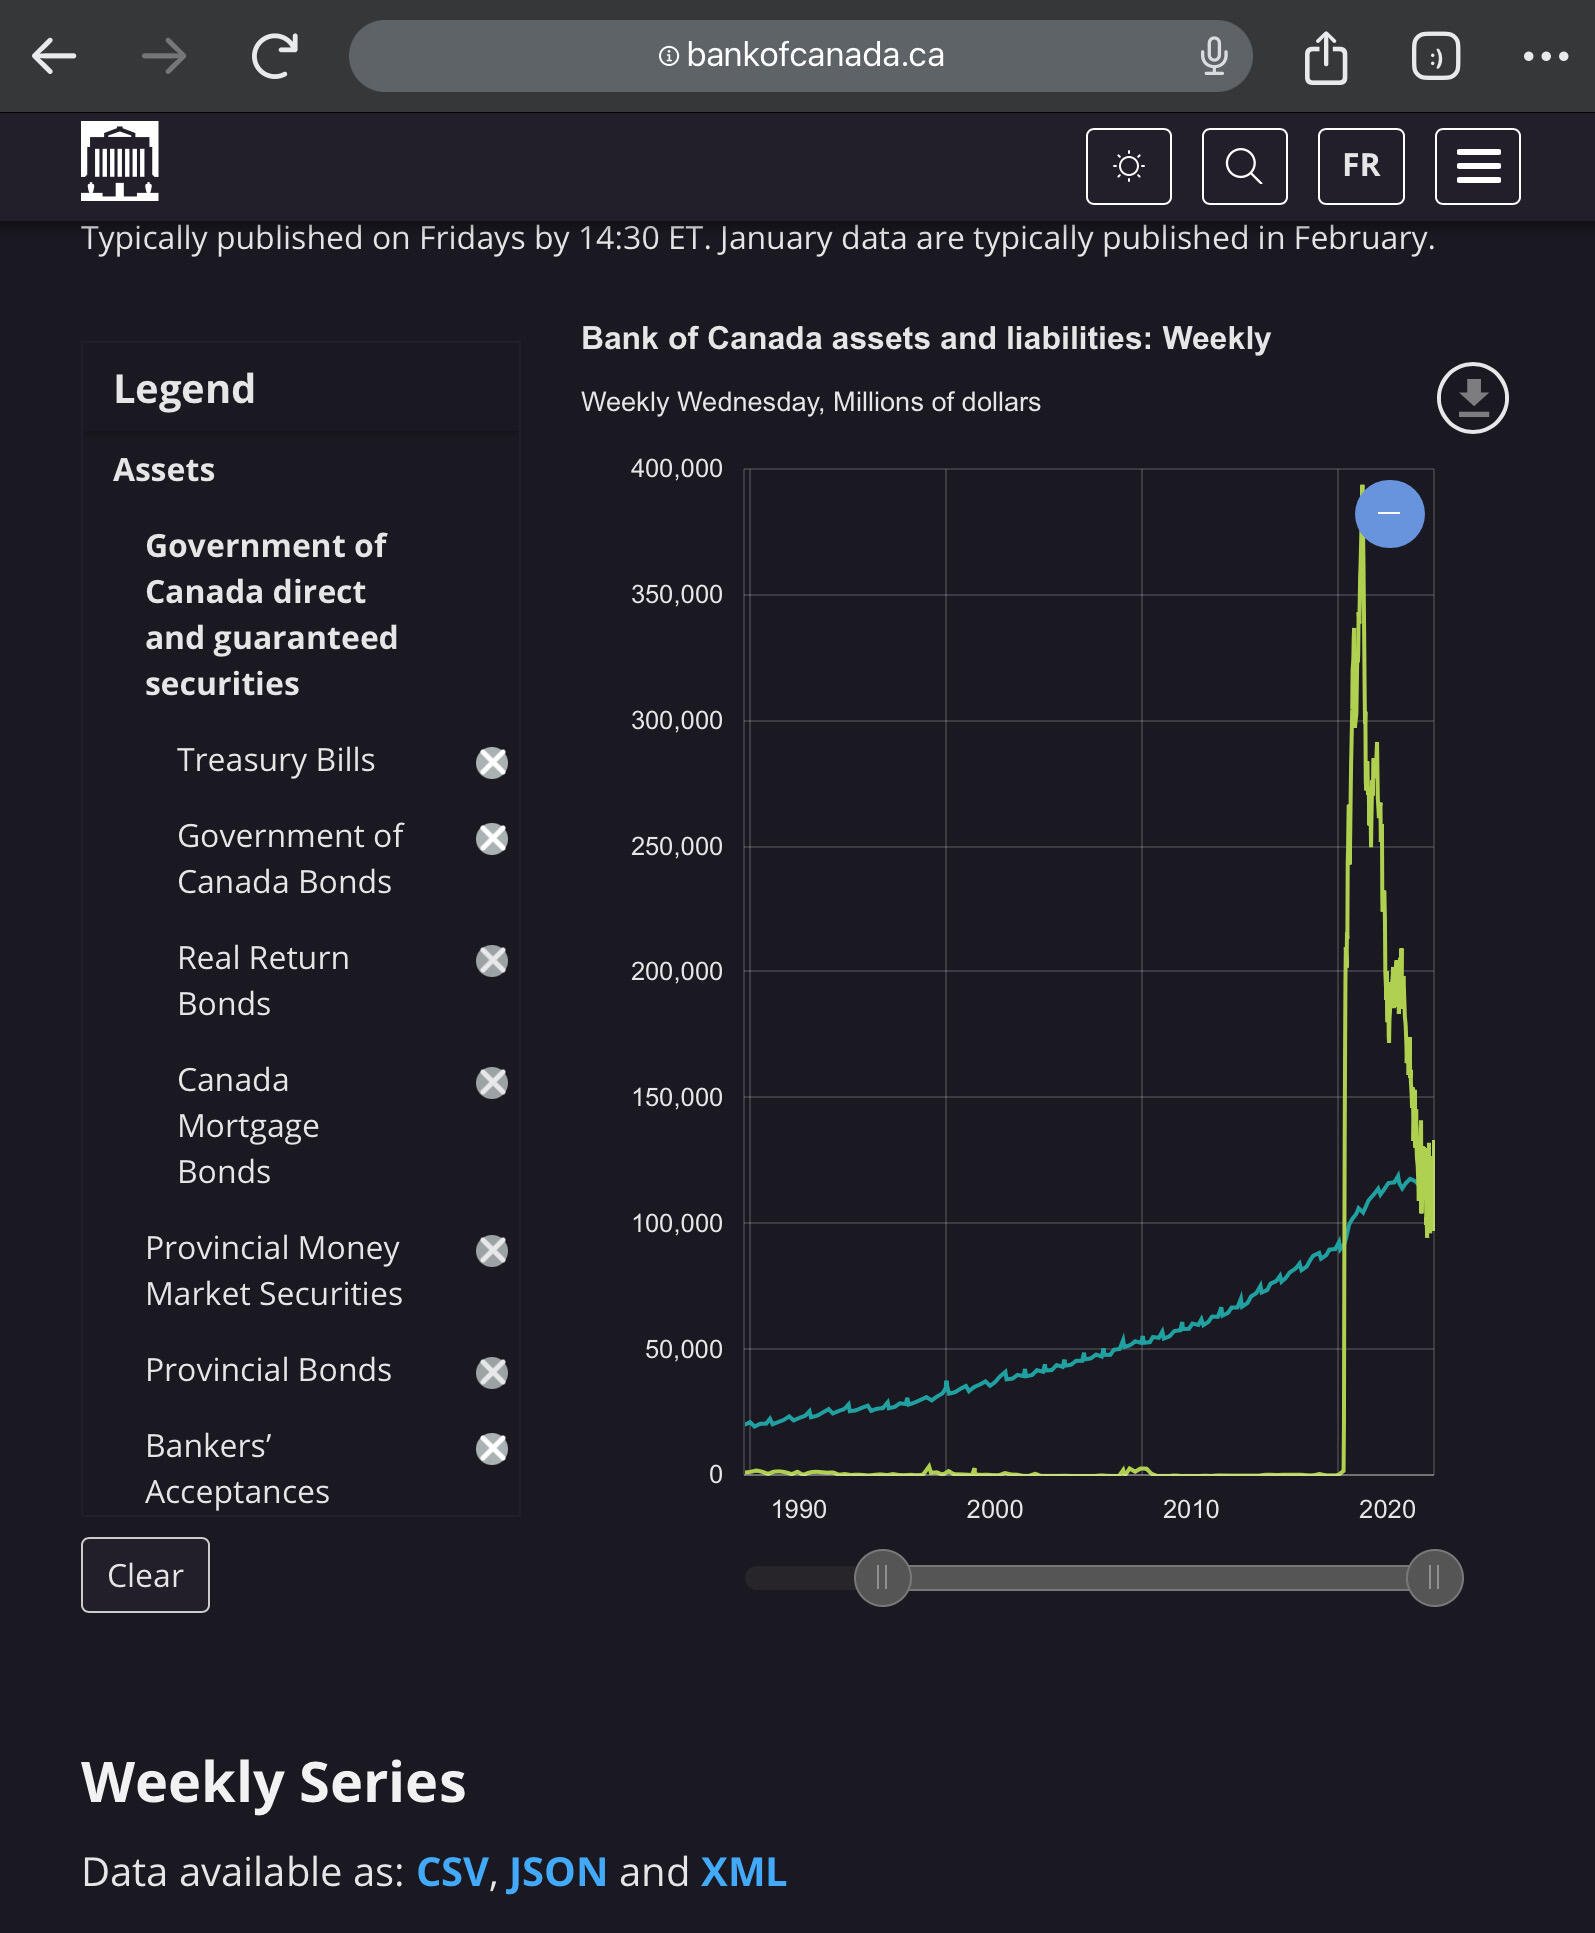
Tim Bouma on Nostr: This diagram of the Bank of Canada balance sheet shows what happened in early 2020. ...
This diagram of the Bank of Canada balance sheet shows what happened in early 2020. The greyish curve is banknotes (M0’ in circulation, a steady uptick from the 90s from about $25B to 2024 of about $125B. Then boom, at the outset of the pandemic, the yellowish curve, liabilities to banks shot up to $400B. That is the sudden M1 expansion due to the government issuing debt, the central bank buying that debt, and the government holding this newly converted debt as ‘cash’ deposits in banks for injecting into the economy as emergency funding. We all know how that played out - pump $400B worth of spending power into the economy that is shut down, the money goes after immovable assets, namely real estate.

Published at
2024-11-16 12:41:39Event JSON
{
"id": "d75d37d0b4093af5d5c6f4185731ee80b08de9a15e21ba8cdd72d43801dda814",
"pubkey": "06b7819d7f1c7f5472118266ed7bca8785dceae09e36ea3a4af665c6d1d8327c",
"created_at": 1731760899,
"kind": 1,
"tags": [
[
"imeta",
"url https://image.nostr.build/20818f3bade89a67f0b9f159c897c5609a4236e1a978324d33e056e1179e2297.jpg",
"blurhash e14_to-qxtjYM{_NRiRjt7t7_4oxRQxut7?aM{M{o#t7.7o#acV@ay",
"dim 1595x1933"
],
[
"r",
"https://image.nostr.build/20818f3bade89a67f0b9f159c897c5609a4236e1a978324d33e056e1179e2297.jpg"
]
],
"content": "This diagram of the Bank of Canada balance sheet shows what happened in early 2020. The greyish curve is banknotes (M0’ in circulation, a steady uptick from the 90s from about $25B to 2024 of about $125B. Then boom, at the outset of the pandemic, the yellowish curve, liabilities to banks shot up to $400B. That is the sudden M1 expansion due to the government issuing debt, the central bank buying that debt, and the government holding this newly converted debt as ‘cash’ deposits in banks for injecting into the economy as emergency funding. We all know how that played out - pump $400B worth of spending power into the economy that is shut down, the money goes after immovable assets, namely real estate. https://image.nostr.build/20818f3bade89a67f0b9f159c897c5609a4236e1a978324d33e056e1179e2297.jpg ",
"sig": "6f0f6151181c8f8a545411ed1226af5fabe93bb1e3b8229f4e30bc446c3f402aae91e79dc02566febabce06defd1f3daef113cf08259e2ce7d4b41401ab2e84e"
}


