Nicola Rennie on Nostr: For Day 3 of the #30DayChartChallenge, the prompt is "Circular" 📊 ☀️ Sunburst ...
For Day 3 of the #30DayChartChallenge, the prompt is "Circular" 📊
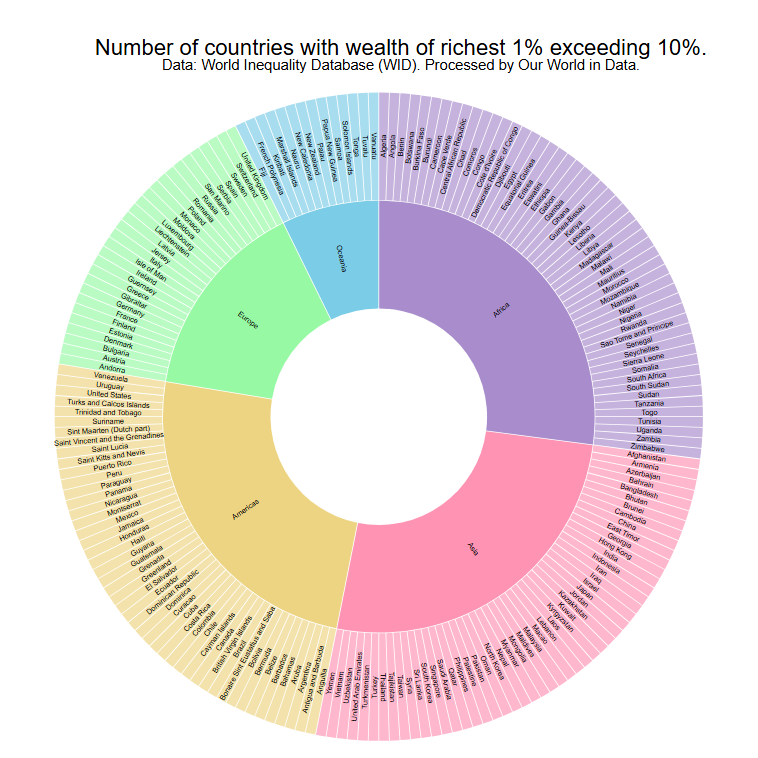
☀️ Sunburst plot showing countries where 1% have >10% of wealth
📈 Data formatting #RStats to create JSON data
👁️🗨️ Figured out how to edit an imported D3 chart in Observable
#Day3 #DataViz #Observable
Published at
2025-04-03 09:04:03Event JSON
{
"id": "d42f6bb1271fb2881207f4de3c3ead642d91df9cc8ebbfea3ea55ae35c76a7e4",
"pubkey": "a82ca2cb099bc69209675340fa77eb6fd775a7aac964a8594a24a778d10729ac",
"created_at": 1743671043,
"kind": 1,
"tags": [
[
"t",
"30DayChartChallenge"
],
[
"t",
"rstats"
],
[
"t",
"day3"
],
[
"t",
"dataviz"
],
[
"t",
"observable"
],
[
"imeta",
"url https://cdn.fosstodon.org/media_attachments/files/114/273/225/369/733/910/original/63cfaaddc6658188.png",
"m image/png",
"dim 758x758",
"blurhash UPQvdxp+?]zhC8j^#kf4^lZ=tlpB]OnPEMbt"
],
[
"proxy",
"https://fosstodon.org/users/nrennie/statuses/114273225510645066",
"activitypub"
]
],
"content": "For Day 3 of the #30DayChartChallenge, the prompt is \"Circular\" 📊 \n\n☀️ Sunburst plot showing countries where 1% have \u003e10% of wealth\n📈 Data formatting #RStats to create JSON data\n👁️🗨️ Figured out how to edit an imported D3 chart in Observable\n\n#Day3 #DataViz #Observable\n\nhttps://cdn.fosstodon.org/media_attachments/files/114/273/225/369/733/910/original/63cfaaddc6658188.png",
"sig": "5bebcce605d8e4d7d8b975fbcab21ab78e390635b667f0a714933814338d2da5f0485cc72b06e0584a2d2664db1d21af5c9b35838bb63bcf6aec7961b0c9894e"
}