Event JSON
{
"id": "5587f6d0b97982ce8278e900f8d41a29967db3ef01e65790552556627a36f517",
"pubkey": "a82ca2cb099bc69209675340fa77eb6fd775a7aac964a8594a24a778d10729ac",
"created_at": 1744212819,
"kind": 1,
"tags": [
[
"t",
"tidytuesday"
],
[
"t",
"dataviz"
],
[
"t",
"rstats"
],
[
"t",
"ggplot2"
],
[
"imeta",
"url https://cdn.fosstodon.org/media_attachments/files/114/308/726/946/549/634/original/5415de795f869a88.png",
"m image/png",
"dim 926x800",
"blurhash URQb|daf.7oMoyt7WBkB?[ofV[ofkCWBxuay"
],
[
"proxy",
"https://fosstodon.org/users/nrennie/statuses/114308731323312952",
"activitypub"
],
[
"client",
"Mostr",
"31990:6be38f8c63df7dbf84db7ec4a6e6fbbd8d19dca3b980efad18585c46f04b26f9:mostr",
"wss://relay.mostr.pub"
]
],
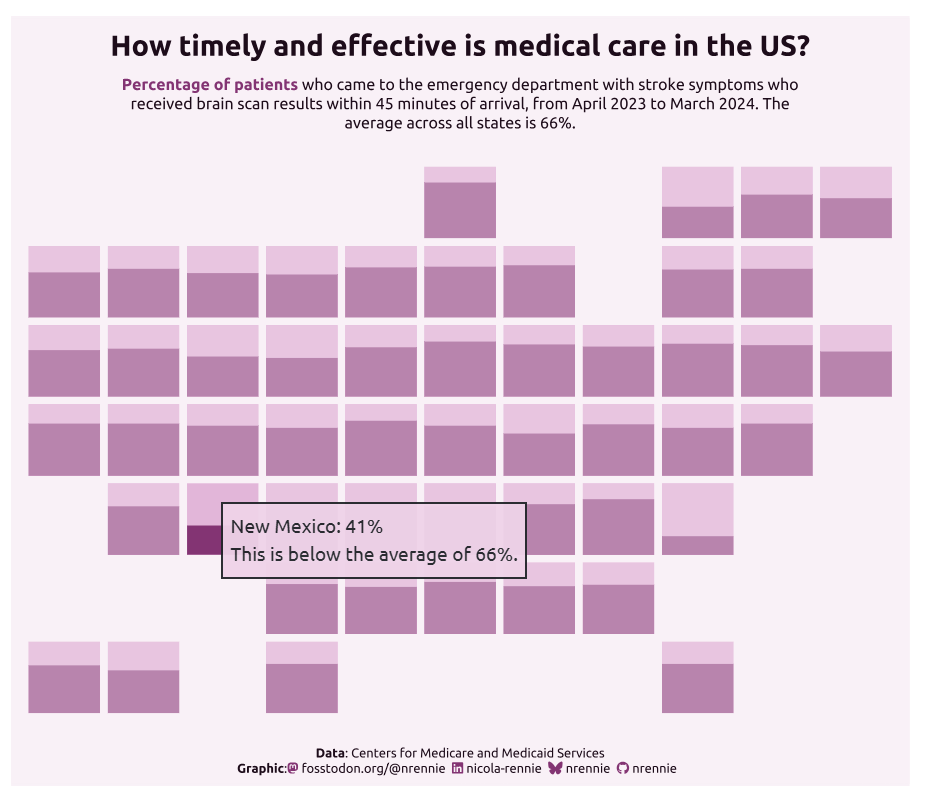
"content": "For this week's #TidyTuesday, we're looking at healthcare efficiency in the USA 👩⚕️ I wanted to create a very minimalist data-art plot, with tooltips that give more information 💬\n\n🗺️ Map grid from {geofacet}\n🦒 Interactive tooltips with {ggiraph}\n🎨 Styling with CSS\n\n#DataViz #RStats #ggplot2\n\nhttps://cdn.fosstodon.org/media_attachments/files/114/308/726/946/549/634/original/5415de795f869a88.png",
"sig": "0cf3e8113559533633e0ed6c639b9e61d59aea8bab4fb31f585de5109045f918c887728f08412cd26e5b8e4979eb155415a15c24ce434b03de9dd0aecedb3c20"
}