Event JSON
{
"id": "51fdf04ebcea215959a83b8fbbb470e3d4fe317bca89b54bd1182cf6b8738b2b",
"pubkey": "a82ca2cb099bc69209675340fa77eb6fd775a7aac964a8594a24a778d10729ac",
"created_at": 1744189584,
"kind": 1,
"tags": [
[
"t",
"30DayChartChallenge"
],
[
"t",
"day9"
],
[
"t",
"dataviz"
],
[
"t",
"d3"
],
[
"imeta",
"url https://cdn.fosstodon.org/media_attachments/files/114/307/199/534/110/703/original/d60b2557ab5dab8e.png",
"m image/png",
"dim 768x1313",
"blurhash UDS$lnX9%g~qTeM|nNxDDiNGo}t6pIRjaKoe"
],
[
"proxy",
"https://fosstodon.org/users/nrennie/statuses/114307208625413333",
"activitypub"
],
[
"client",
"Mostr",
"31990:6be38f8c63df7dbf84db7ec4a6e6fbbd8d19dca3b980efad18585c46f04b26f9:mostr",
"wss://relay.mostr.pub"
]
],
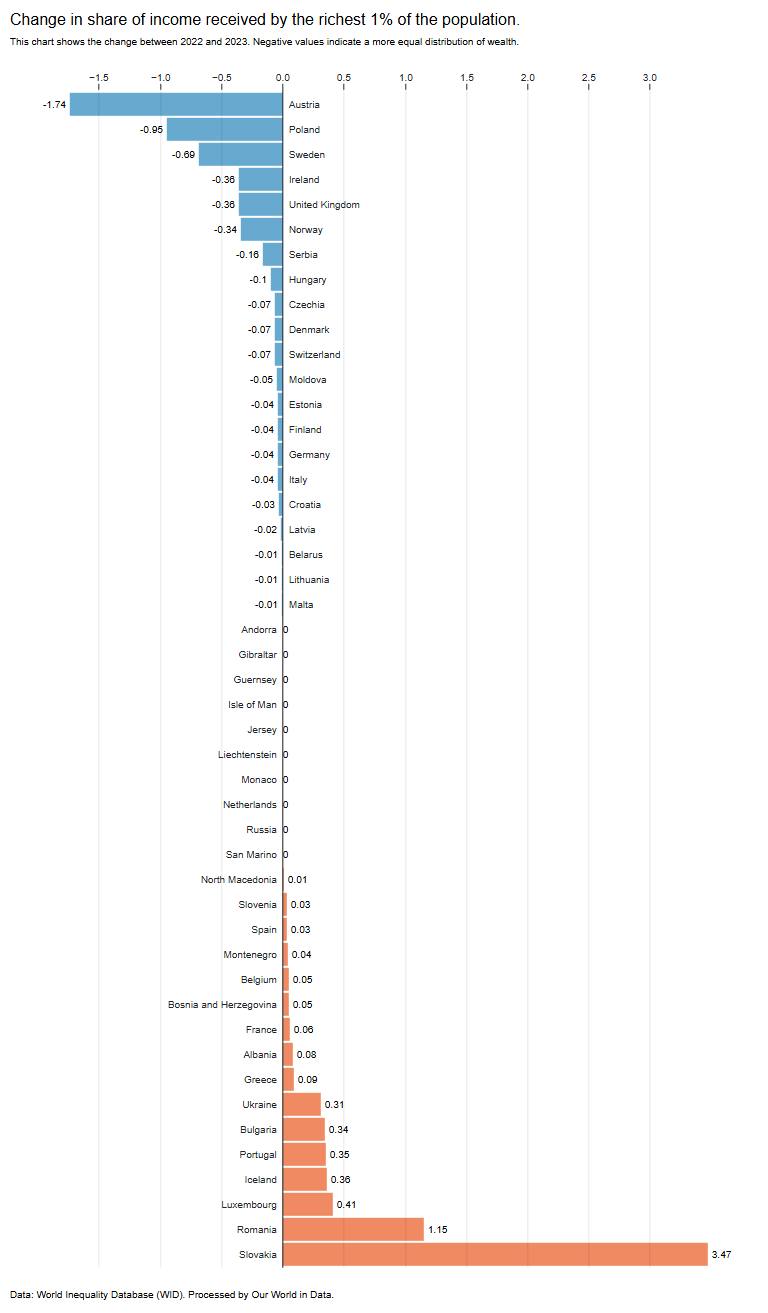
"content": "It's Day 9 of the #30DayChartChallenge, and the prompt is \"Diverging\" 📊 \n\n📉 Looking at % point change in wealth inequality between 2022 and 2023 in Europe\n💻 Made with D3\n🔍 (Interactive version is large so text looks a little small in the screenshot!)\n\n#Day9 #DataViz #D3\n\nhttps://cdn.fosstodon.org/media_attachments/files/114/307/199/534/110/703/original/d60b2557ab5dab8e.png",
"sig": "61c638c6df0fdd58b808b97040aea97a1da743541718d55bc8937284ba5ff4ecb5e9b5da62dac1bc1ac540e371497f987c4991dcd3b04c7574fce8ee3ef0b280"
}